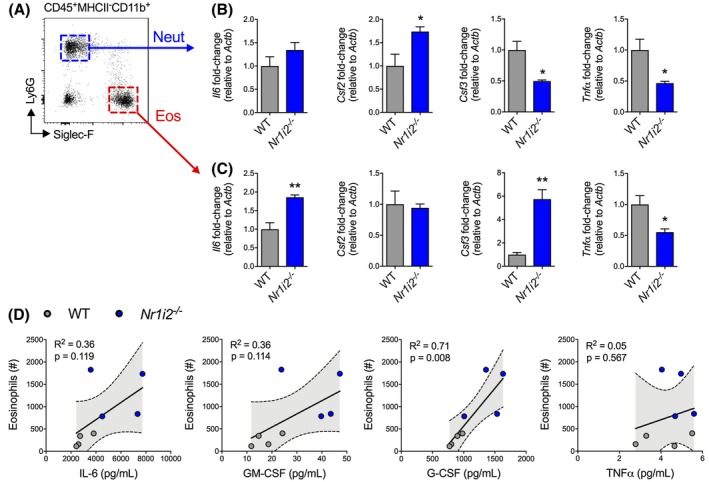
Figure 4.

Aberrant cytokine responses in innate immune cells isolated from the colon of Nr1i2−/− mice following TcdA/B exposure. A, Two hours following colonic exposure to TcdA/B, neutrophils (blue box and arrow) and eosinophils (red box and arrow) were sorted from the colonic lamina propria of WT and Nr1i2−/− mice. B‐C, The expression of different cytokines was measured in these different responding innate immune cells via qPCR. Gene expression was normalized to β‐actin (Actb). D, Relationship between eosinophil counts and the production of different cytokines in the colon WT and Nr1i2−/− mice following TcdA/B exposure. Linear regression shown with 95% confidence bound (n = 4 per group). All data are expressed as SEM. The shaded gray area shows the SEM Student's t test, *P < .05, **P < .01
