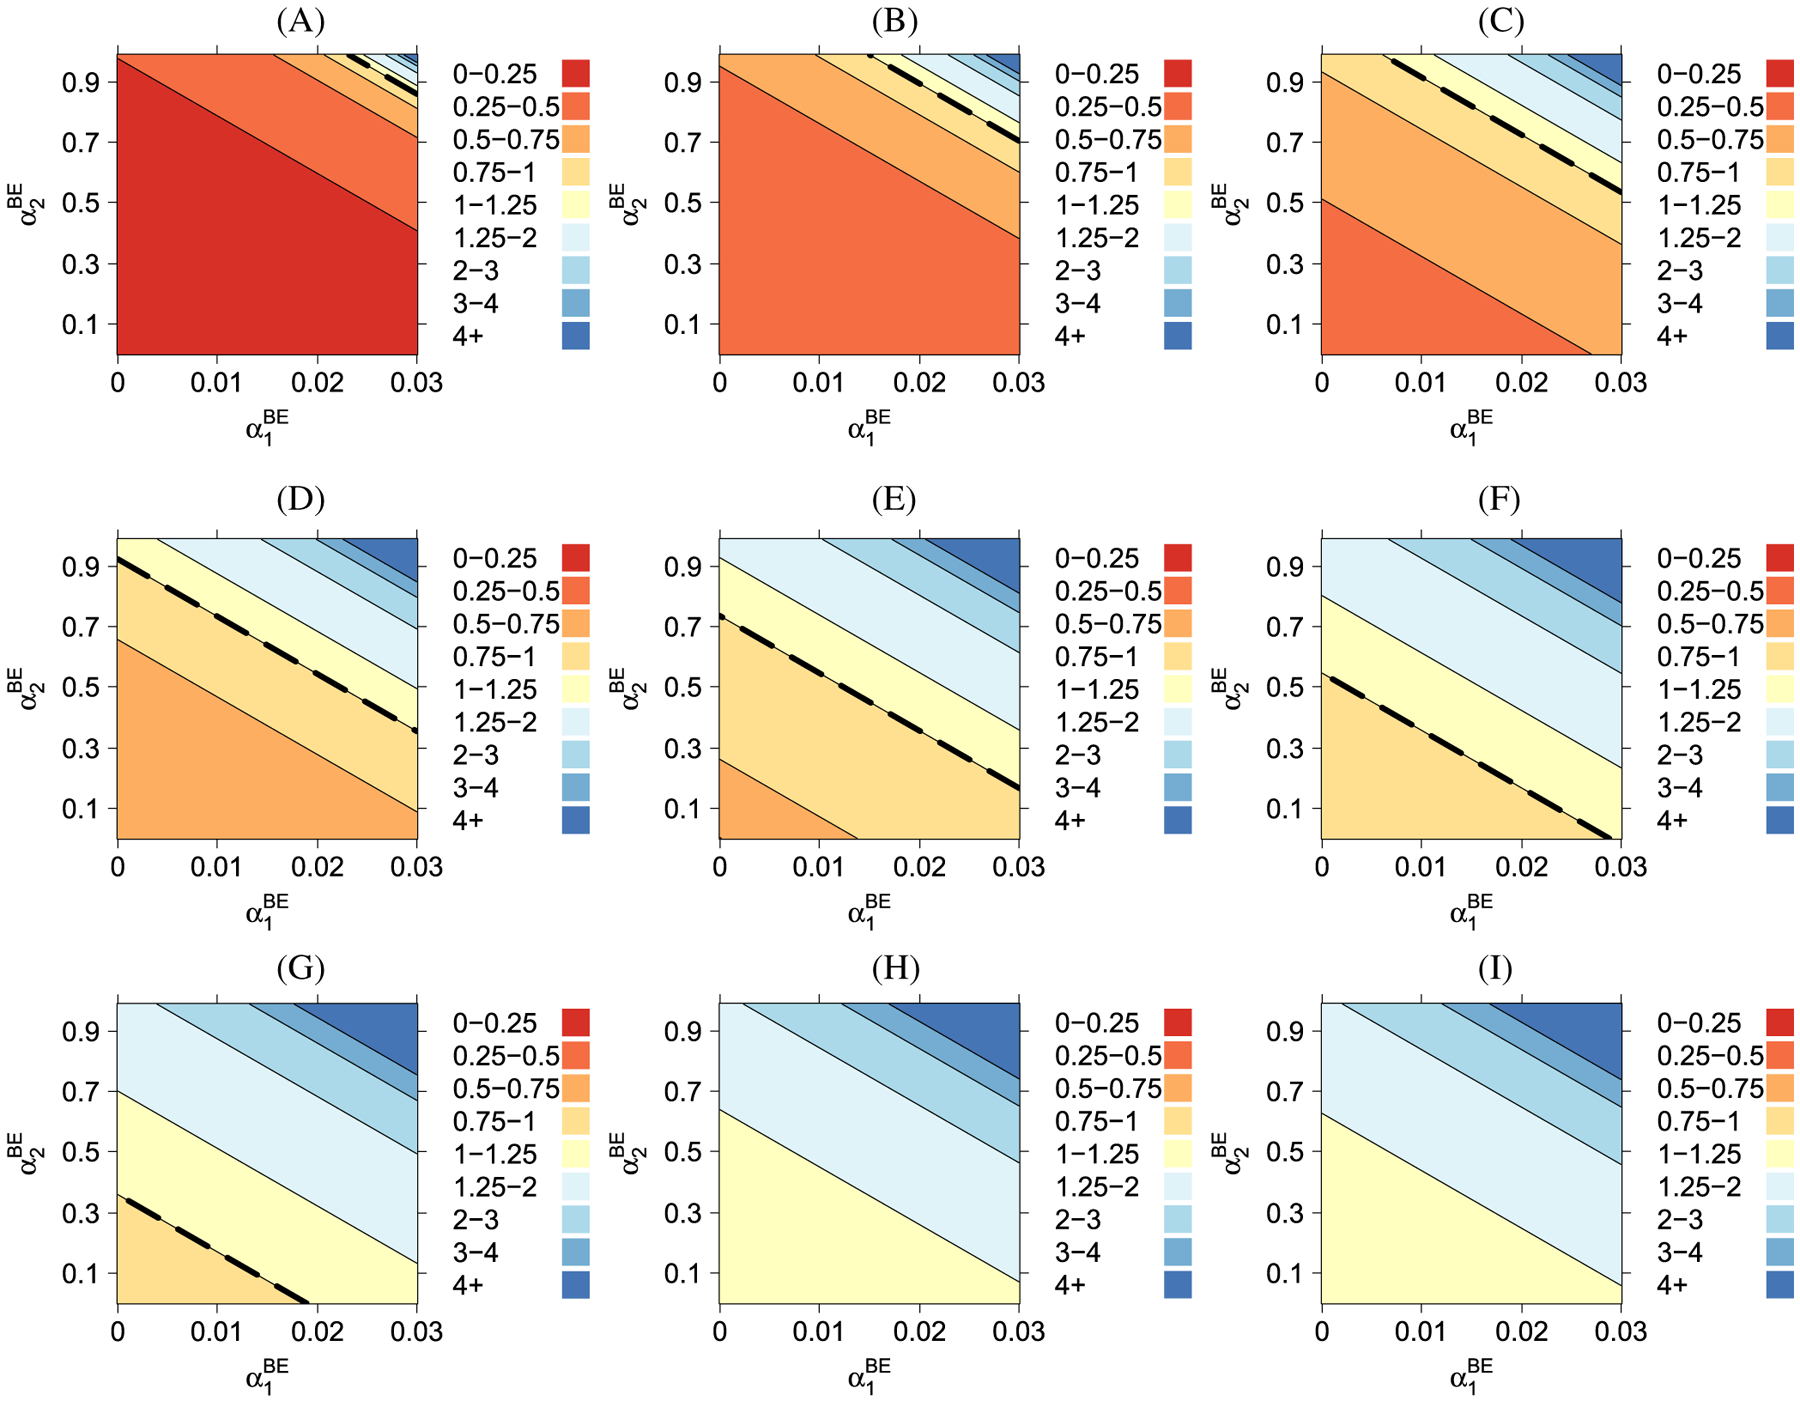
FIGURE 3.

Contour plots for the relative variance obtained under the proportional decay correlation model and the block exchangeable correlation model, for varying values of the proportional decay model decay parameter d and the block exchangeable model correlation parameters , . In all panels, the within-period correlation τ = 0.03, the number of periods T = 4, and the cohort size N = 20. The dashed thick line indicates the equality of variances. A, τ = 0.03 d = 0.1; B, τ = 0.03 d = 0.2; C, τ = 0.03 d = 0.3; D, τ = 0.03 d = 0.4; E, τ = 0.03 d = 0.5; F, τ = 0.03 d = 0.6; G, τ = 0.03 d = 0.7; H, τ = 0.03 d = 0.8; I, τ = 0.03 d = 0.9
