
TABLE 2.
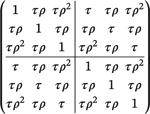
Examples of the proportional decay structure for cohort designs and the exponential decay structure for cross-sectional designs. The illustration is based on a stepped wedge trial with T = 3 periods and Ni = 2 measurements per cluster period. Define yi = (yi11, yi12, yi13, yi21, yi22, yi23)′
| Proportional decay structure | Exponential decay structure | |
|---|---|---|
| corr(yi) | 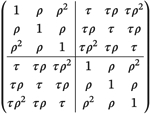 |
 |