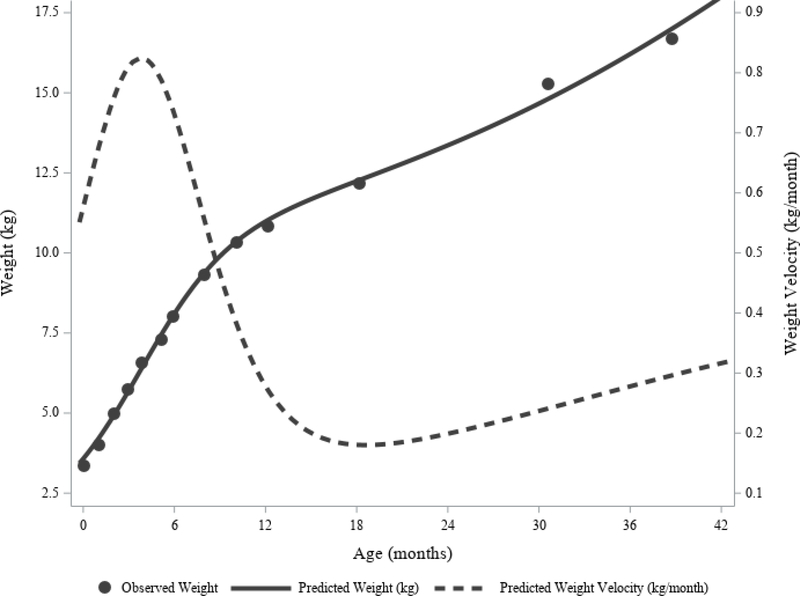
Figure 3. Observed versus Predicated Postnatal Weight and Weight Velocity for an Average Child in the SELMA Study.
This individual child had 13 observations available through 39 months of age (dots), with time between observations increasing with age. Visual inspection shows that the predicted weight estimates (solid line) fit well to the observed weights. The predicted weight velocity curve (dashed line) estimates that the peak velocity occurs at approximately 3.7 months of age.

