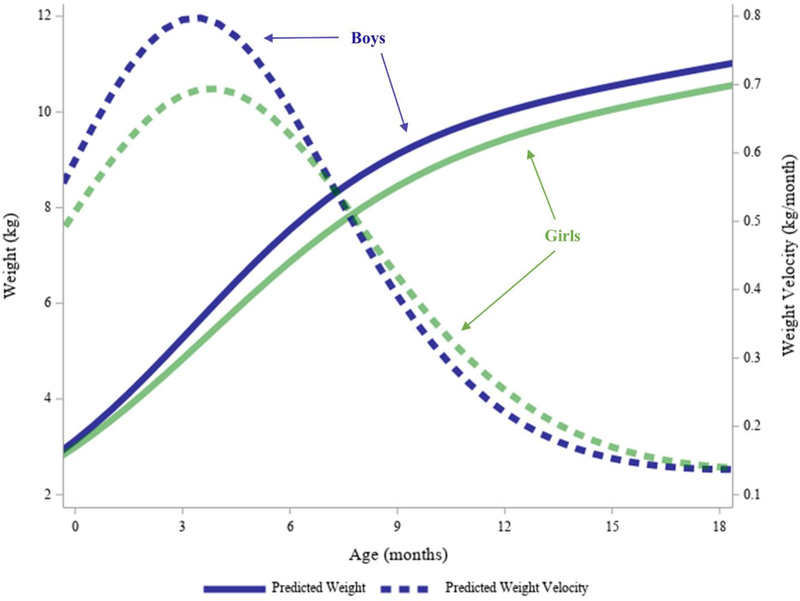
Figure 4. Average Predicted Weight and Weight Velocity Trajectories from Birth to Age 2 Years by Sex.
Predictions are shown through age 18 months to emphasize differences between girls and boys in infancy. On average, boys weigh more than girls from birth, and this difference increases through the first year of life due to a steeper slope (β1). Infant PGV is higher and occurs sooner (δ1) for boys compared to girls. Note that the velocity curve graphed here uses both terms in Equation 8 by necessity.

