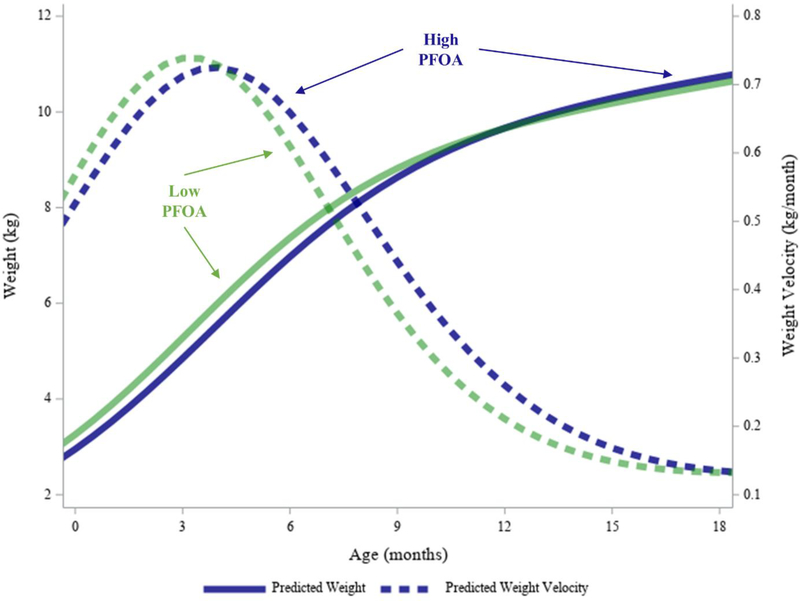
Figure 5. Average Predicted Weight and Weight Velocity Trajectories for High versus Low (10th versus 90th Centile) Prenatal PFOA Exposure Levels.
Higher PFOA levels were related to significantly delayed infant PGV and higher infant weight plateau. Higher PFOA levels were also related to nonsignificantly lower slope, and longer infant spurt duration. Note that the velocity curve graphed here uses both terms in Equation 8 by necessity.

