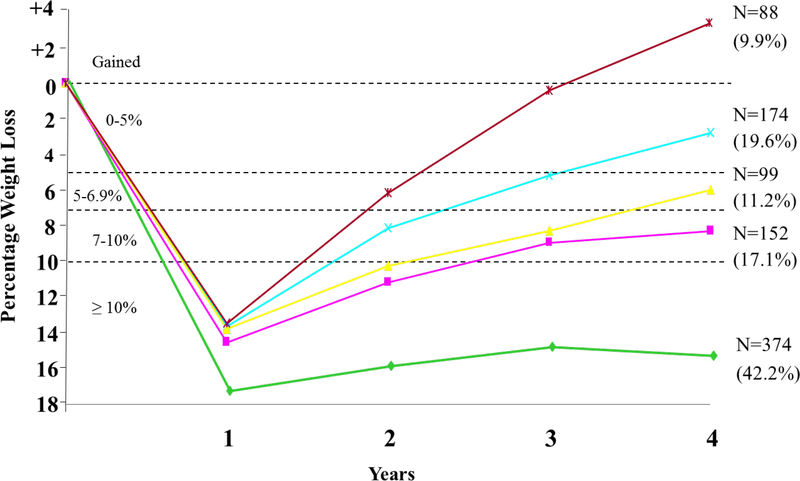
Figure 1.
The figure presents weight loss trajectories over 4 years in the 887 participants in the intensive lifestyle intervention (ILI) who, at year 1, lost ≥ 10% of initial weight. The figure shows the number of participants who, at year 4, maintained a loss of 10% or more of initial weight (N = 374), of 5.0–9.9% (N = 251), or of 0–4.9% (N = 174) or who gained above their baseline weight (N = 88). The percentages shown in parentheses are based on the sample size for the subgroup. Thus, the 374 of 887 participants who maintained a 10% loss at year 4 comprised 42.2% of this subgroup of participants. The figure is reprinted with permission from Wadden et al., 2011.

