Figure 3.
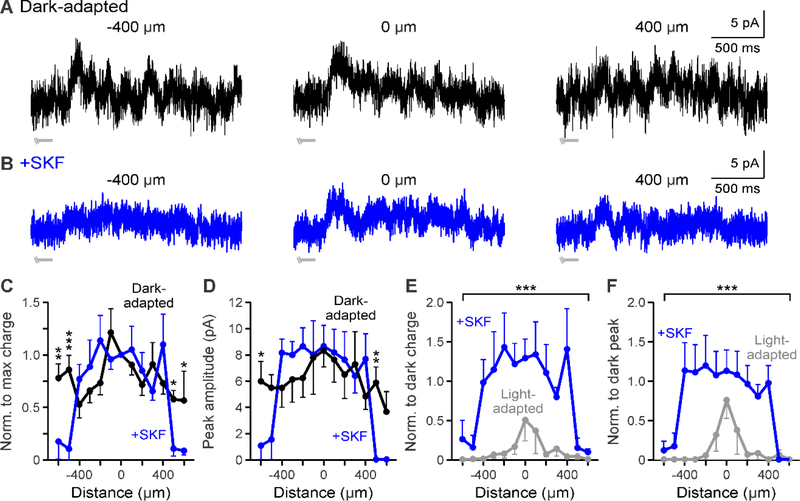
D1 receptor activation affects the edges of GABAergic spatial input to OFF bipolar cells. A-B. Example GABAergic L-IPSCs recorded in dark-adapted (black, A) and dark-adapted + SKF (+SKF, blue, B) conditions. SKF application did not reduce overall response strength 400 μm away from the cell. Light stimulus = light gray disconnected bar under example traces; this OFF type 3 cell responded to the offset of the stimulus so only the end of the light stimulus is shown. C. Spatial inhibition profiles of GABAergic response charge transfer normalized to the center bar stimulus in dark-adapted and SKF conditions (n=4). Inhibition was significantly reduced only at far stimulus distances. D. Same as in C but for GABAergic response peak amplitude. Peak amplitude was only reduced at far stimulus distances. The peak amplitude spatial profile was significantly narrower and smaller with light adaptation. E. Spatial inhibition curves of GABAergic response charge transfer normalized to the respective dark-adapted center bar stimulus in SKF and light-adapted (n=5, gray) conditions. Spatial inhibitory strength was reduced in the near surround more with light adaptation than with SKF. F. Same as in E but for normalized response peak amplitude. The peak amplitude spatial profile was significantly smaller with light adaptation only in the local surround. Cells included in averages: SKF = 1 OFF type 1/2/4 and 3 OFF type 3; light-adapted = 4 OFF type 3. Light-adapted data was adapted from Mazade and Eggers, 2016 Fig. 3C,F for comparison. Error bars are ± SEM and only show the outer bar for each data point. (* p<0.05, ** p<0.01, and *** p<0.001)

