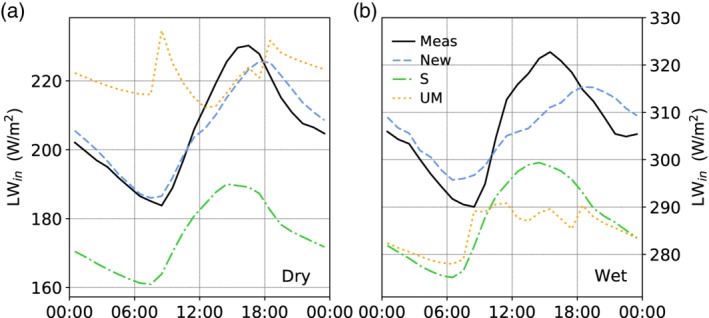
Figure 8.

Mean diurnal cycles of measured LWin (solid lines), and for the UM model (dotted line), the S model (dashed line) and the new parameterization (dashed line) for the dry season (a) and the wet season (b) at Yala BC between 2015 and 2018. Note that the LWin range for is different for both seasons
