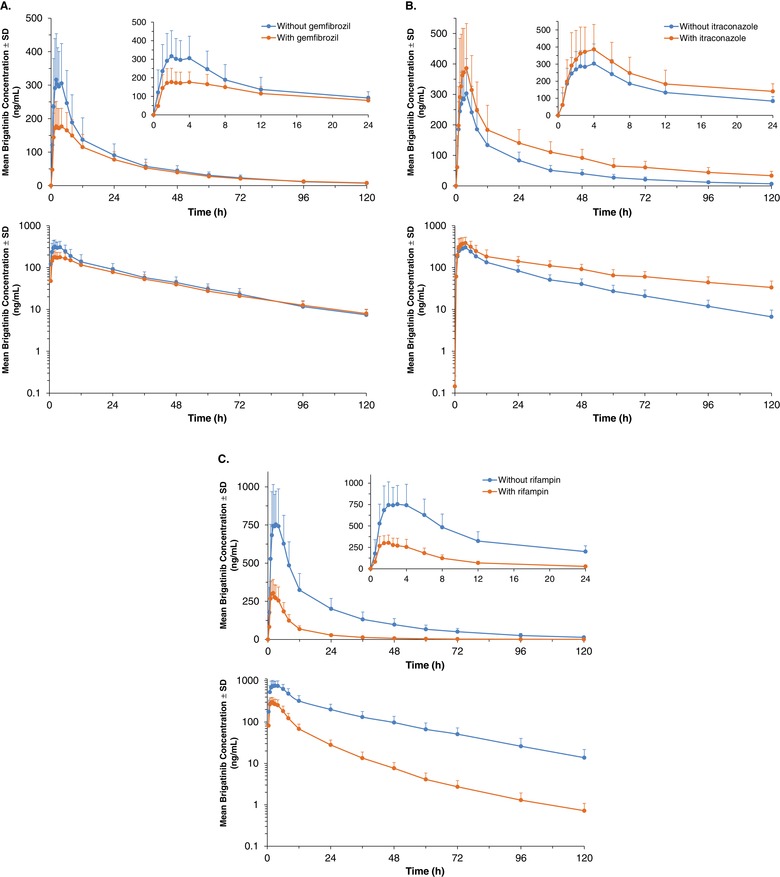
Figure 2.

Mean (±SD) plasma brigatinib concentration‐time profiles (linear and log‐linear plots) with and without coadministration of (A) gemfibrozil, (B) itraconazole, and (C) rifampin (PK‐evaluable population). Insets show the PK profiles for the first 24 hours after dosing. PK indicates pharmacokinetics.
