Figure 4.

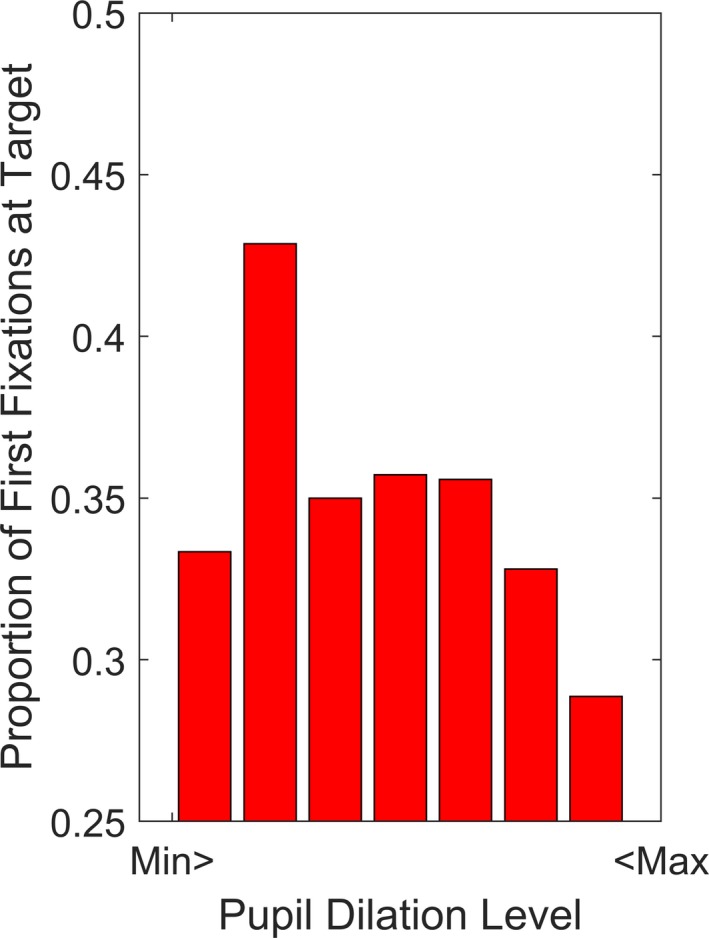
Proportion of first fixations at the target at different levels of pupil dilation amplitude (see Method). Each bar covers 50% of the interquartile range. The Y axis starts at chance level (0.25).

Proportion of first fixations at the target at different levels of pupil dilation amplitude (see Method). Each bar covers 50% of the interquartile range. The Y axis starts at chance level (0.25).