Figure 7.

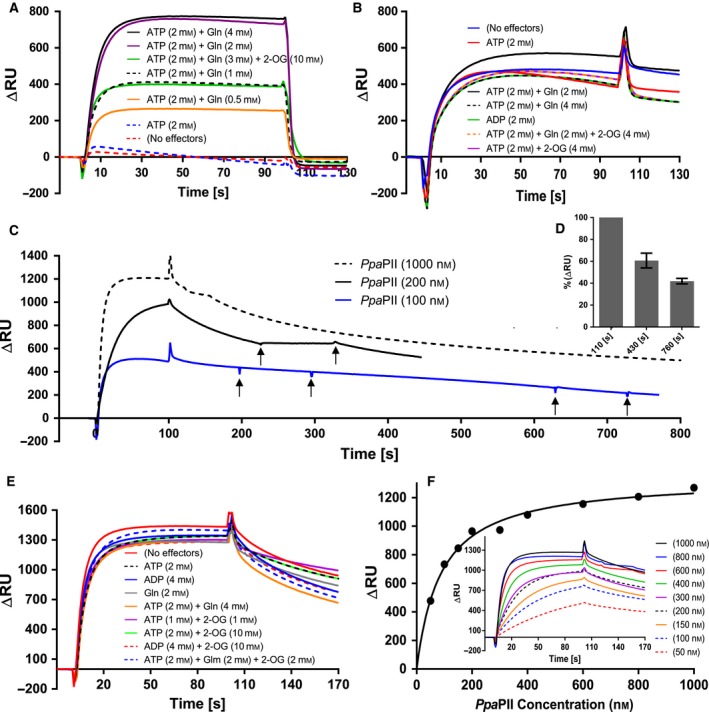
Surface plasmon resonance spectroscopy analysis of PII‐NAGK complex formation. Cr PII or Ppa PII were injected to FC2‐immobilized Cr NAGK or Ppa NAGK. (A) Strict Mg2+‐ATP/Gln dependency of 1000‐nm Cr PII binding to Cr NAGK. (B–F) Binding of 1000‐nm Ppa PII to various NAGK enzymes under various conditions. (B): Binding of Ppa PII to Ppa NAGK, as indicated. (C) Stability of the Ppa PII‐Ppa NAGK complex formed by injection of 100‐, 200‐ or 1000‐nm Ppa PII, as indicated, in absence of any effector molecules during SPR dissociation. The arrows indicate the injection of 2‐mm ADP, which did not affect complex stability/dissociation. (D) Dissociation of Ppa PII‐Ppa NAGK complex; shows the average of the response signals shown in (C) in form of % at t:430s and at t:760s (330s and 660s after the end of the injection, respectively). The signals at t:110s (10s after the end of the injection) were normalized to 100%. SD as indicated by error bars, represents triplicate independent measurements. (E) Binding of 1000‐nm Ppa PII to Cr NAGK, as indicated. (F) K d value for binding Ppa PII to NAGK calculated from ∆RU at t:100s. The inset in (F) shows the Ppa PII titration (from 50 to 1000 nm) to NAGK in absence of effectors molecules, as indicated.
