
Figure 4.
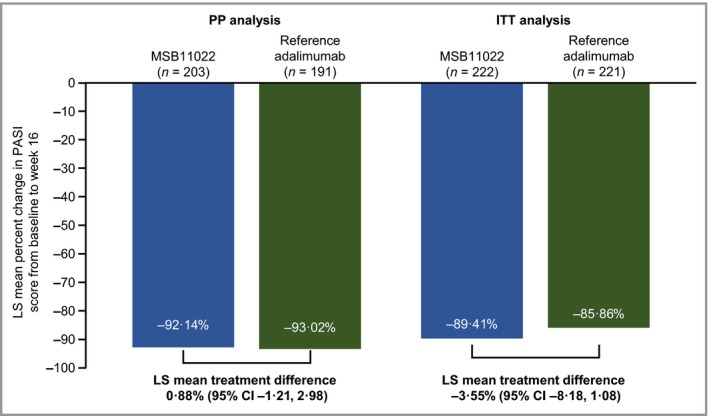
Percentage change in Psoriasis Area and Severity Index (PASI) from baseline to week 16 in the per protocol (PP) and intention‐to‐treat (ITT) analysis sets. LS, least squares; CI, confidence interval.
Official websites use .gov
A
.gov website belongs to an official
government organization in the United States.
Secure .gov websites use HTTPS
A lock (
) or https:// means you've safely
connected to the .gov website. Share sensitive
information only on official, secure websites.
Percentage change in Psoriasis Area and Severity Index (PASI) from baseline to week 16 in the per protocol (PP) and intention‐to‐treat (ITT) analysis sets. LS, least squares; CI, confidence interval.