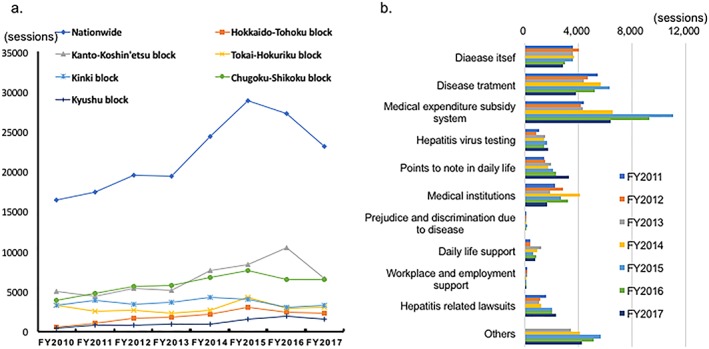
Figure 1.

Summary of counseling sought at counseling centers from fiscal year (FY)2010 to FY2017. (a) Numbers of counseling sessions over time (nationwide and by regional block). (b) Nationwide numbers of counseling sessions by topic over time. [Color figure can be viewed at http://wileyonlinelibrary.com]
