
Figure 3.
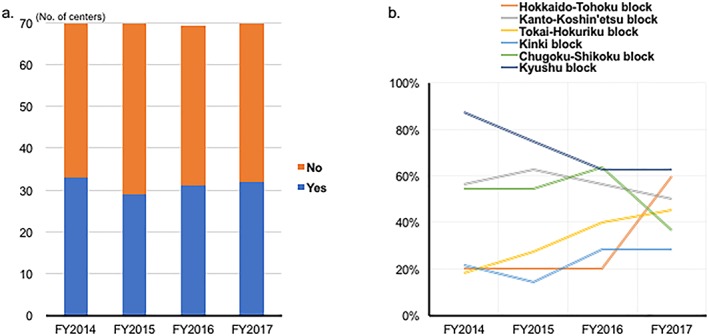
Summary of hepatitis medical care coordinators from fiscal year (FY)2014 to FY2017. (a) Number of centers conducting training. (b) Percentages of centers conducting training by regional block. [Color figure can be viewed at http://wileyonlinelibrary.com]