
Figure 3.
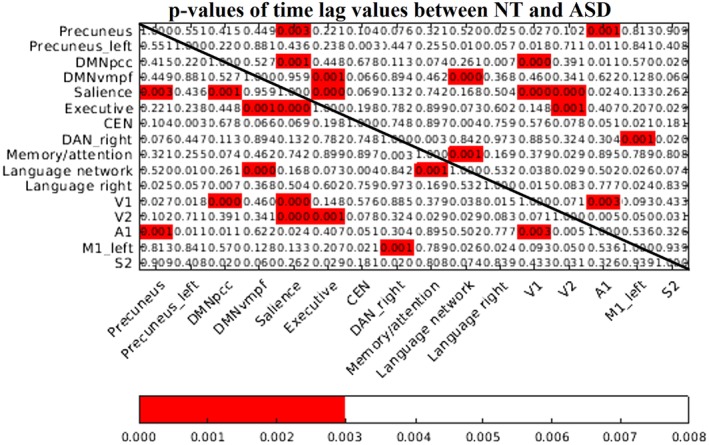
p‐value matrix between neurotypical (NT) and autism spectrum disorder groups. Red p‐values indicate that there are significant lag pattern variations (significance threshold of 0.003) between NT and autism spectrum disorder subjects that survived both Benjamini–Hochberg procedure and surrogate network data corrections.