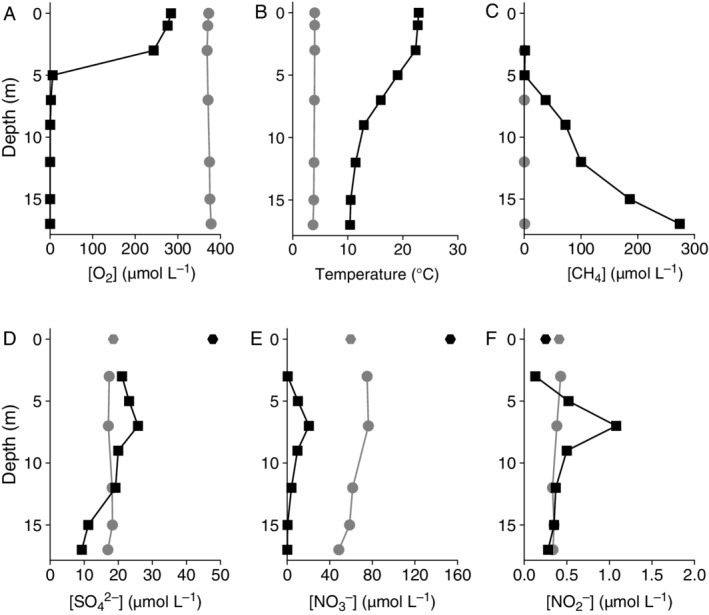
Figure 1.

Physicochemical conditions of Lacamas Lake in August 2016 (black squares) and February 2017 (grey circles).
A. Dissolved oxygen concentration.
B. Temperature (°C).
C. Dissolved methane concentration.
D. Sulfate concentration.
E. Nitrate concentration.
F. Nitrite concentration. The data points at 0 m in (D), (E) and (F) represent the concentrations of sulfate, nitrate and nitrite, respectively, in the inlet stream in summer and winter, sampled 1.5 km upstream of the lake.
