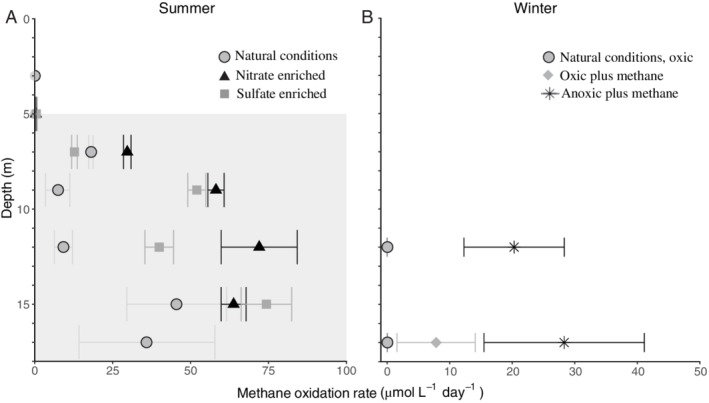
Figure 2.

Methane oxidation rates as determined from incubation experiments in (A) summer electron acceptor experiments and (B) winter methane addition experiments. In (A), the observed methane oxidation rates in natural (unamended) summer conditions (light grey circles), nitrate enriched conditions (black triangles) and sulfate enriched conditions (dark grey squares) are shown. The grey shading indicates the anoxic zone. At 3 and 17 m depth, no enrichment experiments were performed. At 5 m depth, all methane oxidation rates were < 0.5 μM day−1. In (B), natural (unamended) oxic conditions (dark grey inverted triangles), oxic conditions with methane added (grey diamonds) and anoxic conditions with methane added (black stars) are shown for samples from 12 and 17 m depth. A negative rate was observed in the oxic + methane experiment at 12 m depth (results not shown). Note the different scale on both x‐axes. Details are given in Table S1.
