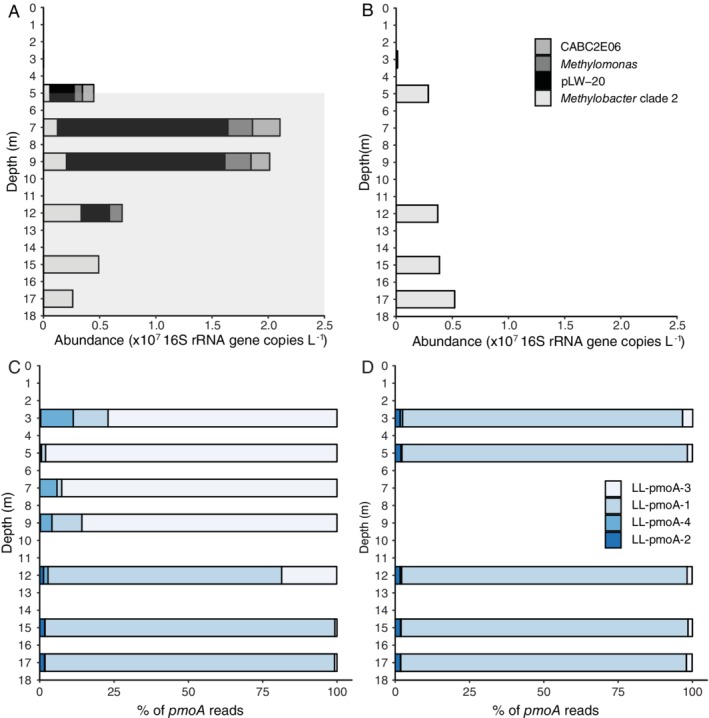
Figure 4.

Abundance and composition of the methanotrophic community in the Lacamas Lake water column in summer and winter.
(A, B) The absolute abundance of the most important methanotrophic community members, as detected by 16S rRNA gene amplicon sequencing combined with qPCR analysis using the same primers.
(C, D) The relative abundance of the detected pmoA sequences. The taxonomic assignment of the 16S rRNA gene and pmoA OTUs is specified in Figs 3 and 5 respectively. The grey area of (A) indicates the anoxic hypolimnion. Details are given in Table S2 and S3.
