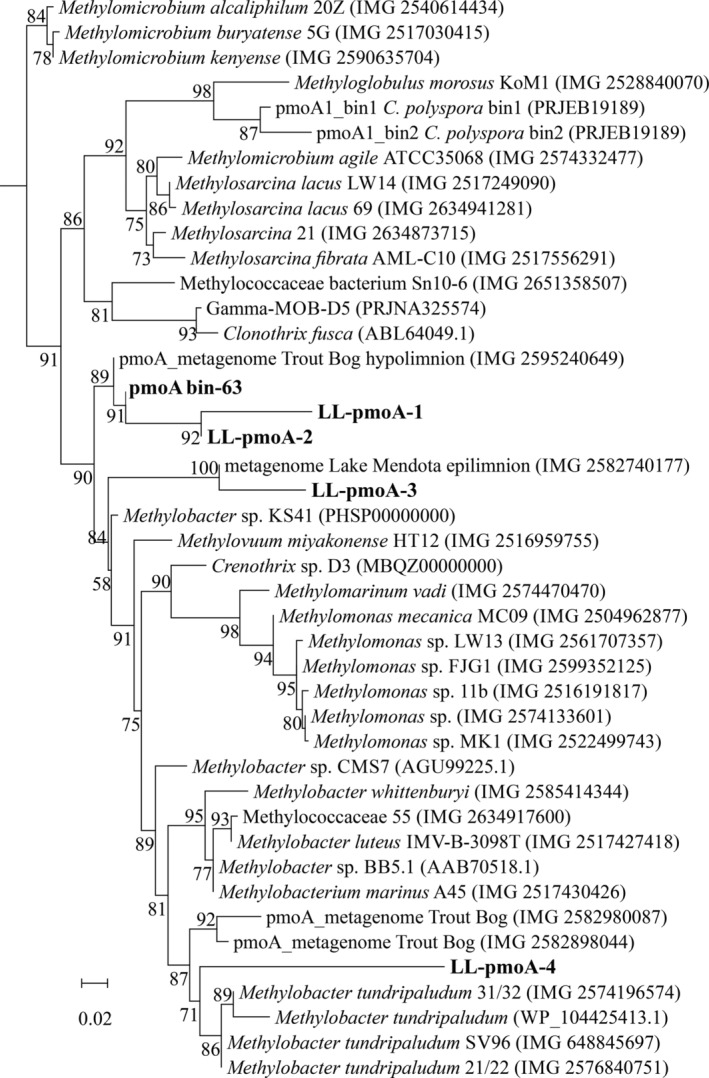
Figure 5.

Maximum likelihood phylogenetic tree of PmoA protein sequences (200 amino fragment) obtained with the pmoA amplicon sequencing assay (see Experimental Procedures for details). The main OTU sequences of Lacamas Lake (LL‐pmoA) as well as the MAG bin‐63 sequence are indicated in bold. Model of protein evolution was LG plus gamma distribution and invariant site, LG+G+I. The scale bar represents number of substitutions per site. Branch support was calculated with the approximate likelihood ratio test (aLRT) and values (%) are indicated on the branches. IMG gene ID number or NCBI accession number are indicated between parentheses.
