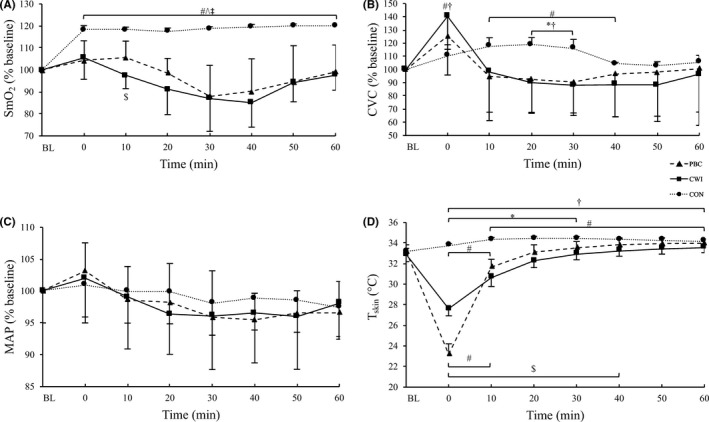
Figure 2.

Results of (A) muscle oxygen saturation of the right vastus lateralis of the quadriceps femoris muscles (SmO2), (B) cutaneous vascular conductance (CVC), (C) mean arterial pressure (MAP), and (D) mean skin temperature (T skin) in function of time. Values for A, B, and C are normalized to baseline (% mean ± SD) with respect to their initial values. BL baseline, # P < .05 compared to baseline, $ P < .05 PBC vs CWI, * P < .05 PBC vs CON, † P < .05 CWI vs CON, ^ P < .001 PBC vs CON, ‡ P < .001 CWI vs CON
