Figure 3.

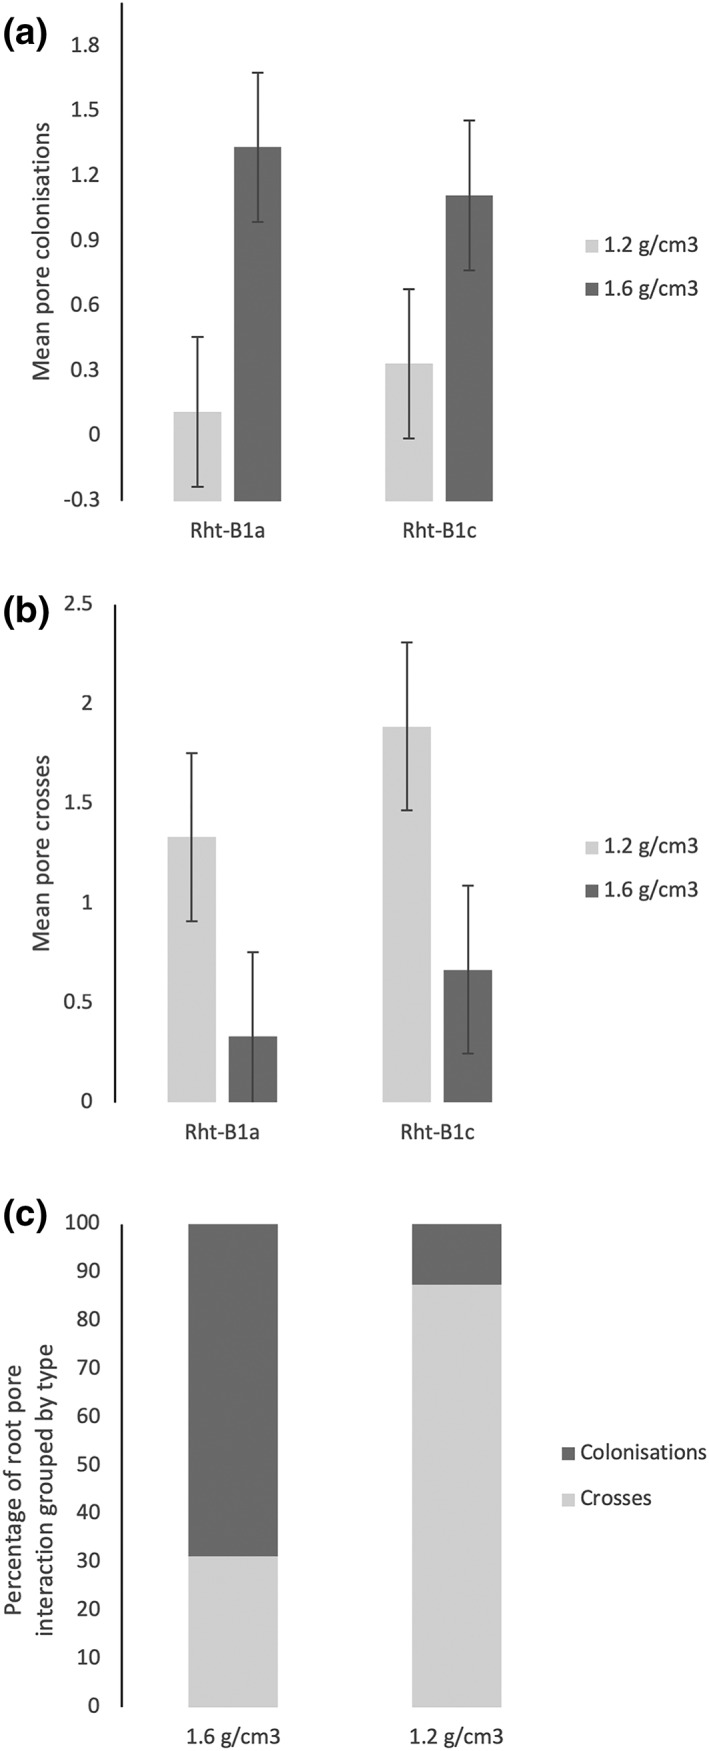
Root–pore interaction data. (a) Mean number pore colonizations. (b) Mean number of pore crosses. (c) Percentage of colonizations/crosses for combined genotype data. Error bars = LSD for p = .05

Root–pore interaction data. (a) Mean number pore colonizations. (b) Mean number of pore crosses. (c) Percentage of colonizations/crosses for combined genotype data. Error bars = LSD for p = .05