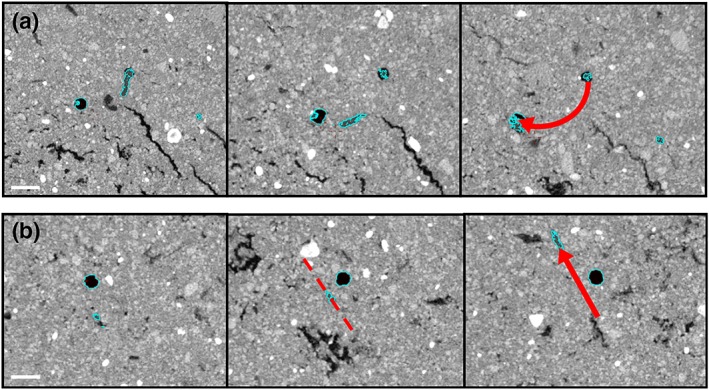
Figure 6.

Example XY 2D X‐ray computer tomography images travelling down the column showing (a) root growth towards a pore and (b) root growth past a pore. The pore is shown in black, the root is highlighted in blue, and the growth path is shown by the red arrow. Scale bars = 2 mm [Colour figure can be viewed at http://wileyonlinelibrary.com]
