Figure 1.

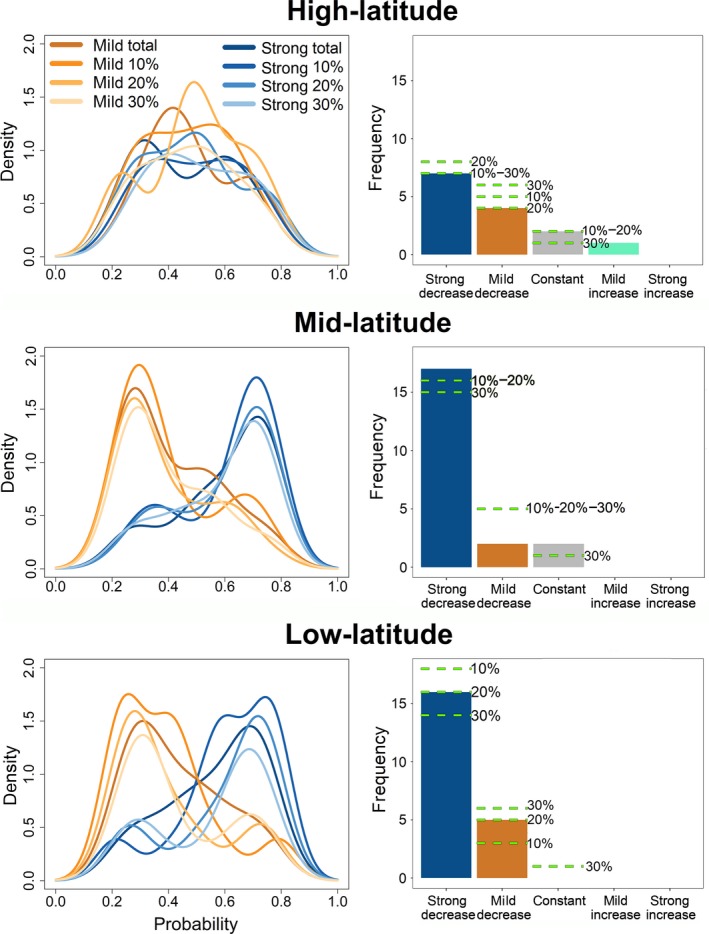
Plots of the probability to find a decrease in extinction rate over time per latitude. Left column: density plots of the probability to find a strong (strongD) or mild (mildD) decrease in extinction rate with species age, across all clades and considering different potential taxonomic biases. The cumulative probability obtained summing strongD and mildD, is close to 1 in most clades. Extinction rates are most strongly decreasing with age at low latitudes, whereas the age dependency weakens (nonetheless remaining the prevalent mode of extinction) at higher latitudes. Tests accounting for potential taxonomic inflation show that the results are robust even if 30% of the species are treated as invalid synonyms. Right column: histograms showing the frequency of each model being the most appropriate per latitudinal band. The horizontal dashed lines represent the same figures under different levels of reassignment of rare species occurrences to other species in the records to account for taxonomic inflation (total = no reassignment, or 10, 20, 30% of reassignments). The only instance for extinction rate increase over time pertains to Cystoporida bryozoans (upper row, light‐green bar).
