
Figure 5.
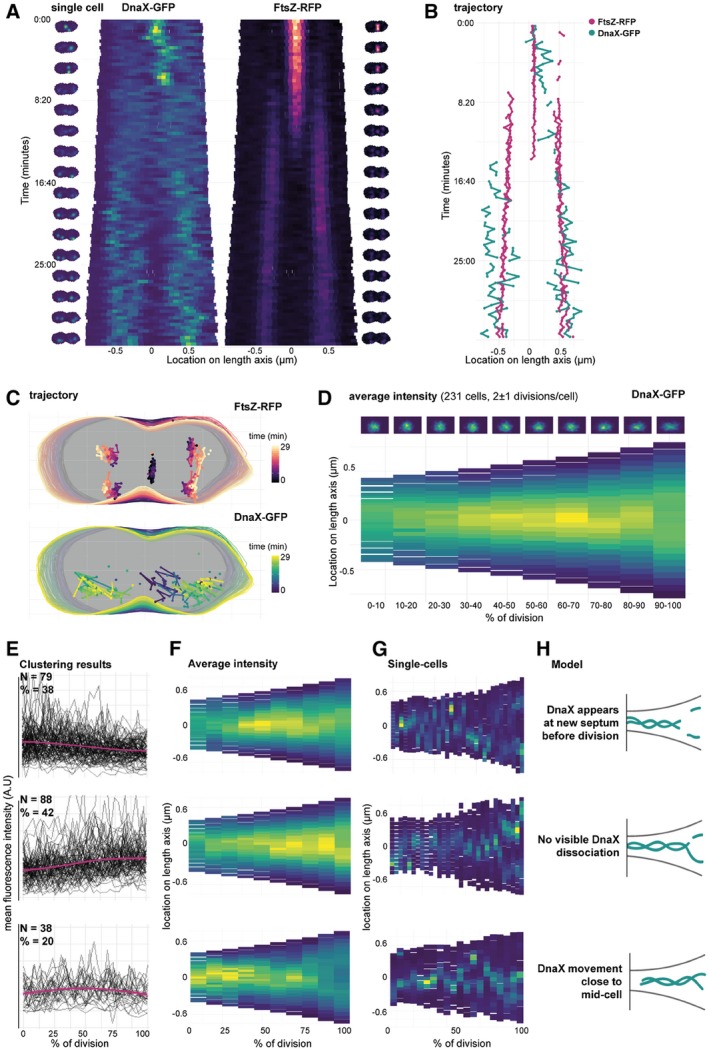
Single‐cell time‐lapse analysis of the replication fork and FtsZ in Streptococcus pneumoniae. (a) Kymographs of a single cell (strain MK396, dnaX::dnaX‐GFP‐eryR, ftsZ::ftsZ‐RFP‐kanR) imaged every 20 s for 1 hr. Cell outlines recorded with Oufti and combined with the raw image data using BactMAP. Left/right of the kymographs are movie strips of the single cell, created with BactMAP. (b) Trajectory over the length axis of the cell over time of FtsZ‐RFP bundles and DnaX‐GFP foci in the same cell as shown in (a). Foci/bundles were tracked with iSBatch. (c) x/y trajectory over time of the cell shown in (a) and (b). Outlines recorded with Oufti, tracks recorded with iSBatch. (d) The growth curves of all cells were determined and curves of non‐growing cells and cells with incomplete cell cycles were discarded. Cell parameters were binned in ten groups by % of division. Bottom: average intensity of GFP signal over the length axis of the cell per % of division. Top: density plots of x/y coordinates of recorded GFP foci per binned % of division. x/y coordinates were recorded with iSBatch, cell outlines with Oufti and the raw image files were used by BactMAP to determine the average intensity per bin. (e) Clustering results: average cellular intensity over division percentage. Mean cellular fluorescence intensity (arbitrary units) over percentage of division (pink, standard deviation in shade), with single‐cell fluorescence intensity paths shown in grey. Top‐bottom shows each cluster, the number of clusters (N) and the percentage of the total number of cells (%). (f) Average intensity profile. Average intensity of the length axis of the cell binned in 10 groups based on percentage of division for each of the three clusters (top‐bottom). (g) Single cells. Example kymographs of single‐cell members of each cluster. (h) Schematic models of the various dynamics that were observed for pneumococcal DnaX [Colour figure can be viewed at https://www.wileyonlinelibrary.com]