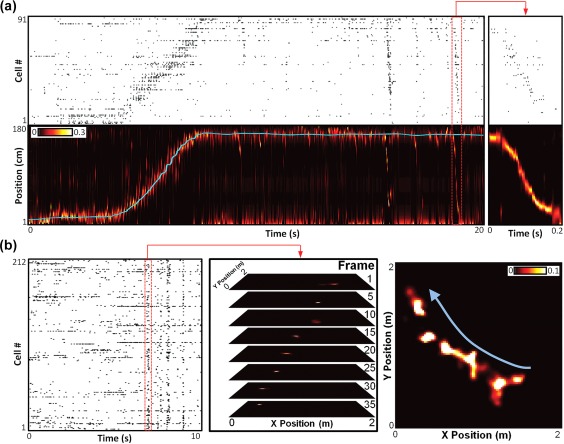
Figure 1.

Examples of hippocampal replay. (a) Example of a linear track replay. Top: Raster plot of 91 simultaneously monitored CA1 place cells recorded while a rat traversed a 1.8‐m‐long linear track, ordered by location of place field peak. Bottom: Cyan line is the rat's actual position along the track during the recording in the top panel. Background color map indicates the rat's estimated position probabilities based on Bayesian decoding of the spike trains in the top panel (20 ms decoding window, advanced in 5 ms increments). Red‐bordered section indicates the spikes and estimated position for one ripple, showing a replay of a trajectory across the track, expanded on the right. (b) Example of an open field replay. Left: Raster plot of 212 simultaneously monitored CA1 place cells recorded while a rat explored a 2 m × 2 m open arena. Middle: Bayesian estimated position probabilities in selected frames from the highlighted ripple‐based spikes. Right: Sum of all decoded frames of the highlighted ripple, demonstrating an encoded trajectory crossing the center of the open arena in the direction of the blue arrow. Data from Pfeiffer and Foster (2015)
