
Figure 4.
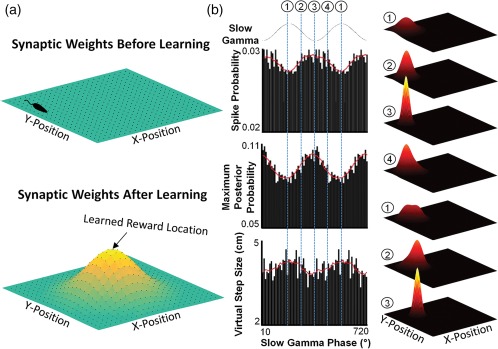
Model of goal‐directed open field replay. (a) Map of hippocampal connectivity weights in a square open arena before (top) and after (bottom) reward learning. Color map represents the strength of the synaptic connection between neural populations (dots) representing adjacent locations. Top: Following extended exploration prior to reward learning, neurons representing adjacent locations will be strongly connected to each other, with all connection strengths relatively equivalent (as denoted by the flat connectivity map). Bottom: Following repeated reward at a single site in the center of the arena, synaptic weights acquire a non‐uniform pattern, with stronger connections nearest the reward location. (b) Model of gamma‐based auto‐ and hetero‐associative dynamics underlying spatial trajectory representation during a ripple after reward learning. Left: Three measures of circuit‐level activity during ripples as a function of the slow gamma oscillation (Pfeiffer & Foster, 2015): spike probability (i.e., population firing rate), maximum Bayesian decoded posterior probability (i.e., the precision of the spatial representation within the hippocampus), and the virtual step size (i.e., the likelihood of the spatial representation in the hippocampus transitioning from one location to another). Circled numbers and dashed lines indicate distinct phases of the slow gamma oscillation. Right: Hippocampal spatial representation during a replay (heat map) across the indicated phases of the slow gamma oscillation. (1) Total spike count is low, resulting in a broad, non‐specific spatial representation. (2) As the gamma cycle progresses, spike rates increase. Via auto‐associative dynamics, place cells with overlapping place fields are preferentially activated, while lateral inhibition limits the representation of adjacent locations, tightening the spatial representation. (3) At the trough of the gamma cycle, firing rates are highest, resulting in the strongest auto‐association. Spatial representation is the most precise and accordingly the least likely to transition to a new location. (4) The decrease of excitatory drive on the ascending phase of gamma reduces overall firing rate, weakening the auto‐association and allowing hetero‐associative processes to begin to activate neural populations representing nearby locations. The neurons with the strongest synaptic connectivity to the initially active population are the most likely to be activated during this phase; thus, given the distribution of synaptic weights in the bottom of panel (a), the spatial representation will have the highest probability of transitioning toward the goal location. The cycle repeats several times, with auto‐associative dynamics dominating during periods of high firing rate to ensure high fidelity representation of individual locations and hetero‐associative dynamics dominating during periods of lower population activity in which the spatial representation moves according to established network synaptic weights (and thus moving toward locations of known salience)