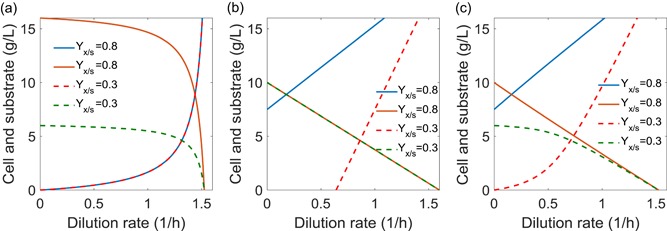
Figure 2.

Analytical solutions for three growth models in CSTR culture. (a) Monod growth model; (b) Logistic growth model; and (c) the hybrid Logistic‐Monod growth model. All the three models have the same parameter settings (μ m = 1.6 hr−1; X m = 10 g/L; K S = 1 g/L; and S F = 20 g/L) except for Y x/s. The dotted line represents the low‐biomass‐yield (Y x/s) regime, and the solid line represents a high‐biomass‐yield regime. In Figure 2c, the hybrid Logistic‐Monod model captures the feature for both nutrient‐limited conditions (qualitatively similar to the dotted lines that represent a typical Monod growth as shown in Figure 2a) and growth‐inhibited conditions (qualitatively similar to the solid lines that represent a typical Logistic growth as shown in Figure 2b) [Color figure can be viewed at wileyonlinelibrary.com]
