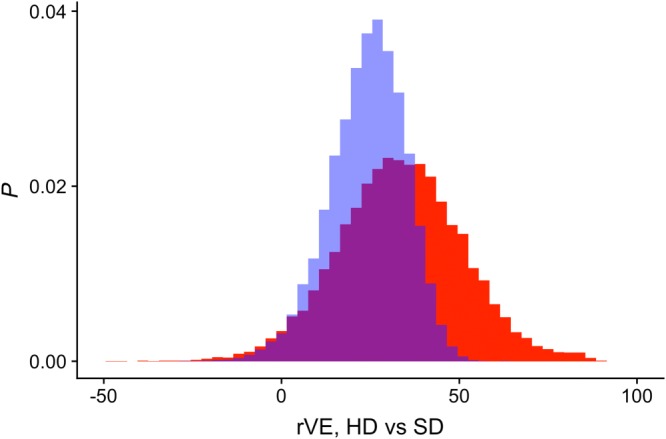
Figure 8.

Output of the probabilistic bias analysis (inputs described in Table 1): posterior distribution of the true treatment effect (red), with the prior event rate ratio estimate of Young‐Xu et al9 (blue) shown for comparison. HD, high dose; SD, standard dose [Colour figure can be viewed at http://wileyonlinelibrary.com]
