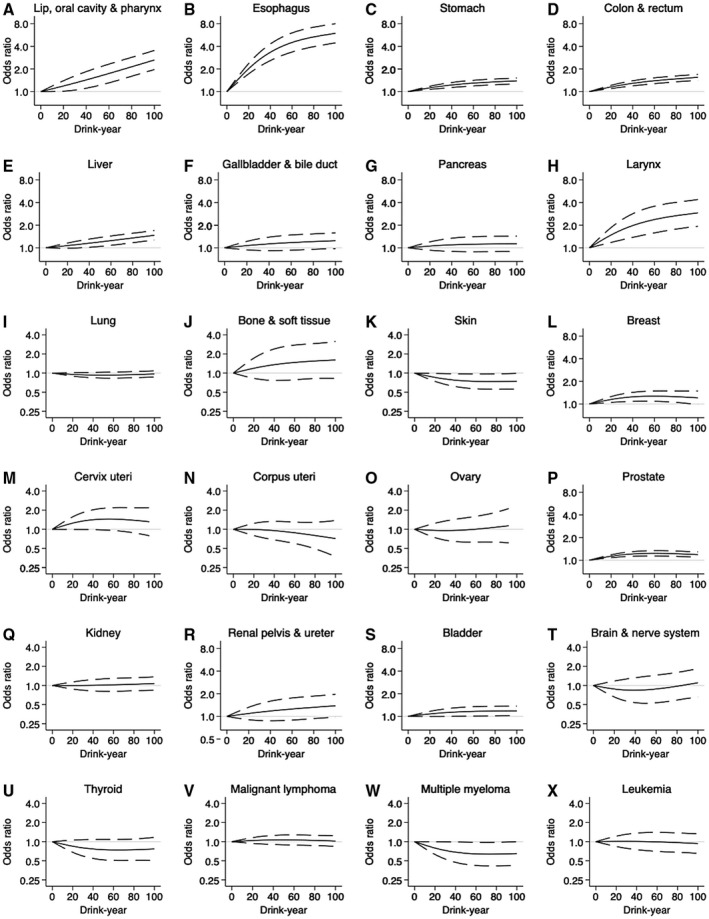
Figure 3.

Cubic spline curves for specific cancer risks against continuous total amount of lifetime alcohol consumption. ORs (solid line) and 95% CIs (dashed line) were estimated by conditional logistic regression, mutually adjusted for smoking history, occupational class, and comorbidities. The numbers of subjects used for the analyses were as follows: (A) 2090 (Lip, oral cavity, and pharynx), (B) 2,816 (Esophagus), (C) 18,710 (Stomach), (D) 19,274 (Colon and rectum), (E) 7208 (Liver), (F) 2700 (Gallbladder and bile duct), (G) 2992 (Pancreas), (H) 1098 (Larynx), (I) 11,944 (Lung), (J) 442 (Bone and soft tissue), (K) 2070 (Skin), (L) 8904 (Breast), (M) 1292 (Cervix uteri), (N) 1650 (Corpus uteri), (O) 1044 (Ovary), (P) 16,742 (Prostate), (Q) 2356 (Kidney), (R) 1332 (Renal pelvis and ureter), (S) 6584 (Bladder), (T) 766 (Brain and nerve system), (U) 1312 (Thyroid), (V) 4354 (Malignant lymphoma), (W) 938 (Multiple myeloma), and (X) 1232 (Leukemia).
