
Figure 1.
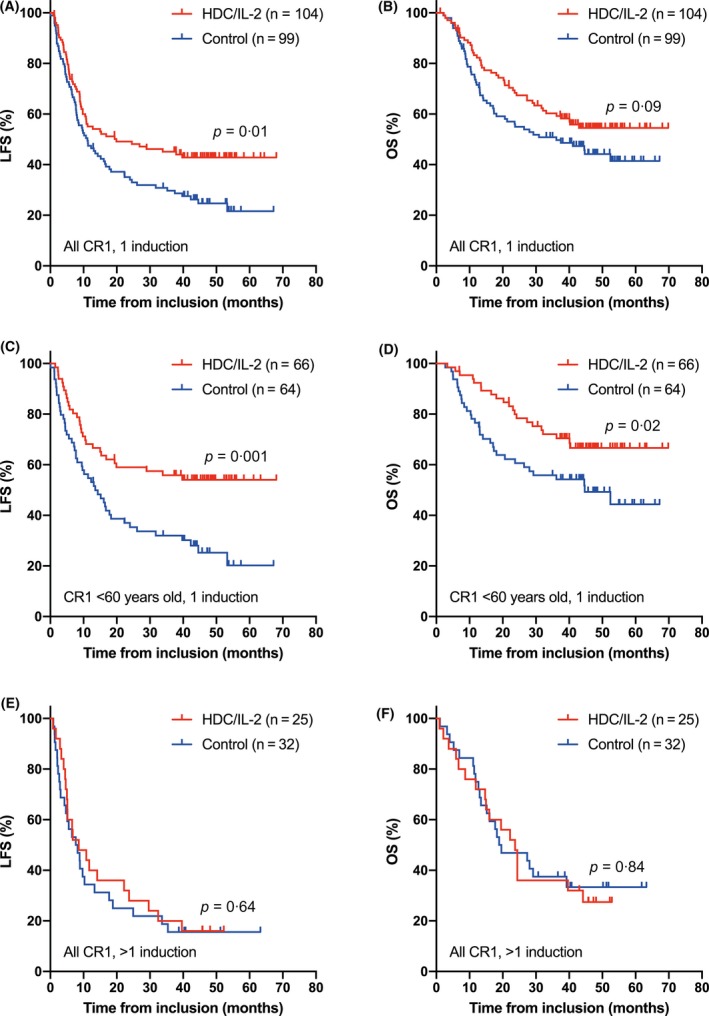
Panels A and B show Kaplan‐Meier plots of LFS and OS in HDC/IL‐2 treated patients or control patients who attained CR1 after the first cycle of induction chemotherapy. Panels C and D show corresponding results in patients <60 years old. Panels E and F show LFS and OS in patients (all ages) who required >1 induction cycle to attain CR1. Statistical analysis was performed by the logrank test.