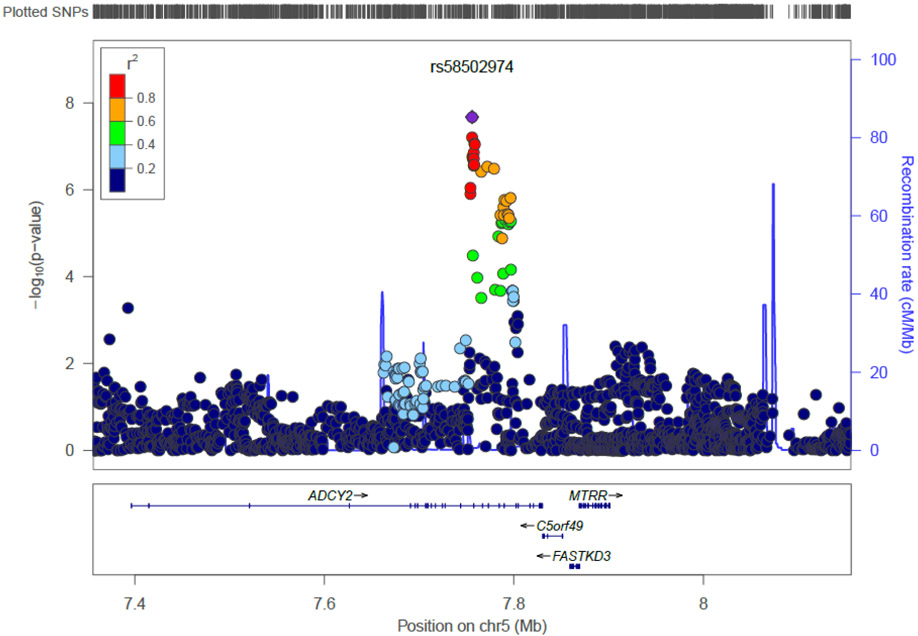
Figure 2C.
Regional plot for genome-wide significant locus on chromosome 5 for the restricted meta-analysis.
Results are shown as –log(p-value) for genotyped and imputed SNPs. The SNP showing strongest association is shown in the purple circle. The color of the remaining markers reflects r2 of the strongest associated SNP. The recombination rate is plotted in blue.

