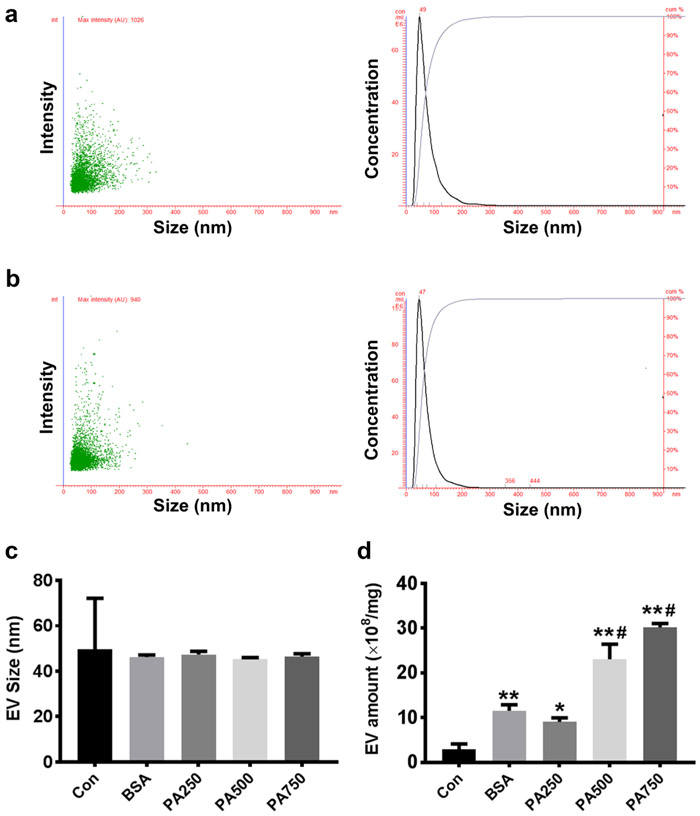
Fig. 3.
PA stimulated EV release from NRK-52E cells. NRK-52E cells were treated with BSA or PA (250–750 μM) for 24 h. Nanoparticle-tracking analysis (NTA) was performed to characterize the EVs isolated from the conditioned media. a–b NTA graphs depict the intensity/concentration in relationship to the size distribution of EVs derived from NRK-52E cells treated with BSA (a) or 500 μM PA (b). c–d The averaged mode values (c) and concentration (d) of isolated EVs released from Con, BSA, and PA (250–500 μM)-treated NRK-52E cells. Data are expressed as mean ± SEM (n = 4). *P < 0.05, **P < 0.01 versus Con; #P < 0.05, ##P < 0.01 versus BSA group

