
Figure 1.
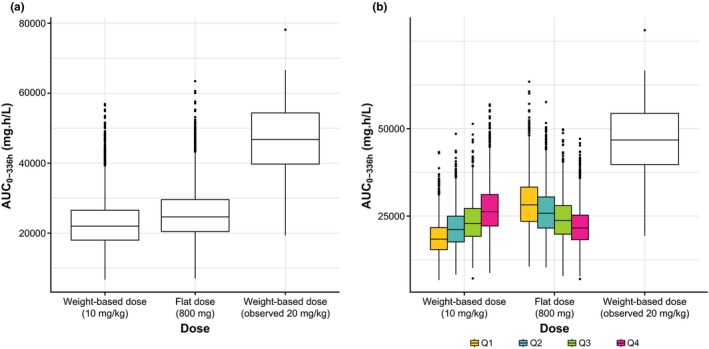
Simulated AUC0–336 h values for weight‐based (10 mg/kg q2w) and flat (800 mg q2w) dosing of avelumab using the first‐cycle population pharmacokinetic model. Box and whisker plots for (a) the entire population and (b) the population split by quartiles of weight; observed data with avelumab 20 mg/kg dosing are included for comparison purposes (n = 27). AUC0–336 h, area under the curve during the first dosing interval.