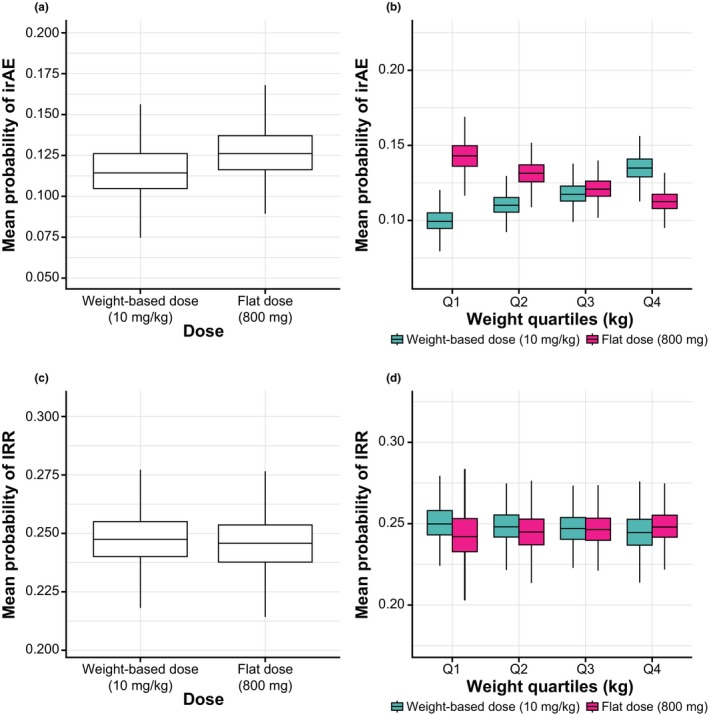
Figure 2.

Mean probability of experiencing an irAE (upper panels) or IRR (lower panels) for weight‐based (10 mg/kg q2w) and flat (800 mg q2w) dosing with avelumab based on the first‐cycle population pharmacokinetic model. Box and whisker plots for (a) probability of irAEs based on AUC0–336 h in all patients; (b) probability of irAEs based on AUC0–336 h stratified by quartiles of weight; (c) probability of IRRs based on Cmax in all patients; and (d) probability of IRRs based on Cmax stratified by quartiles of weight. AUC0–336 h, area under the concentration curve during the first dosing interval; Cmax, maximum concentration; irAE, immune‐related adverse event; IRR, infusion‐related reaction.
