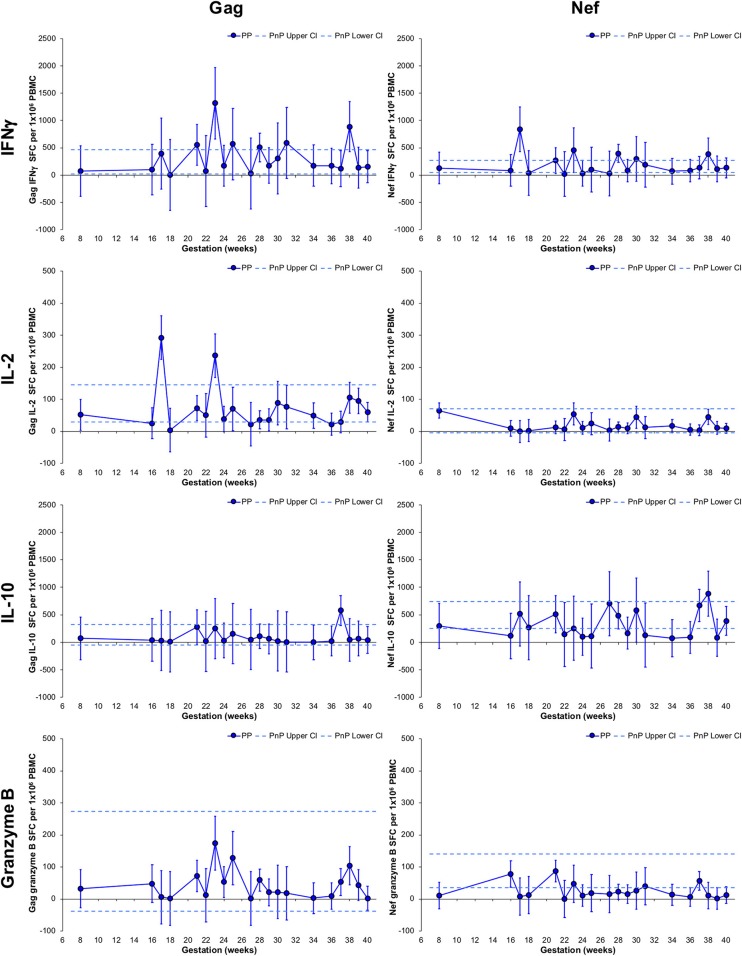
Figure 2.
Longitudinal assessment of HIV-1-specific responses of pregnant HIV-1 positive women. The left-hand side graphs show longitudinal changes in Gag response and the right-hand side graphs illustrate changes in Nef response in HIV-1 positive pregnant women (n = 49, median 3 per participant). From top to bottom IFNγ, IL-2, IL-10, and granzyme B ELISpot responses are shown. The straight dashed lines show the upper and lower 95% CI for the HIV-1 positive non-pregnant group, which were assessed at a single time-point (n = 11). Longitudinal assessment of the HIV-1 positive pregnant participants was undertaken using non-linear MIXED methods analysis, with point estimates and 95% CI bars shown.

