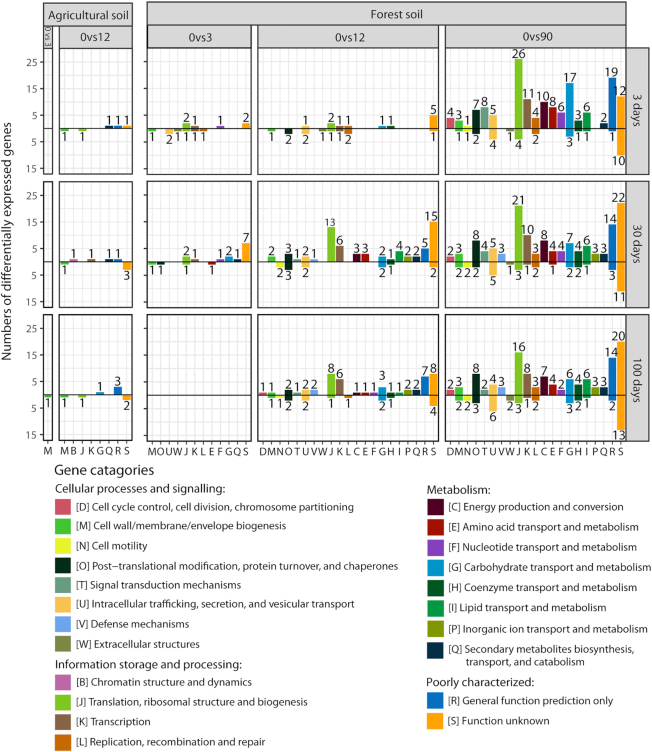
Figure 4.
Numbers of differentially expressed genes within functional categories across agricultural and forest soil by pairwise comparisons of gene transcription levels between samples of increasing wood ash concentration to reference samples without ash amendment at different incubation times. ‘0vs3, ‘0vs12’ and ‘0vs90’ denote the wood ash doses compared, i.e. wood ash dose 0 t ha−1 compared to 3 t ha−1 is written as ‘0vs3’. Increasing and decreasing gene transcription levels are presented above and below the black horizontal zero line, respectively. The pairwise comparisons for forest soil, 100 days, were carried out using 3 t ha−1, 100 days, as reference samples because only one replicate was acquired from the 0 t ha−1, 100 days, samples (hence the empty plot in 0vs3, 100 days, forest plot). Digits above/below bars represent the number of differentially expressed genes within a gene category.

