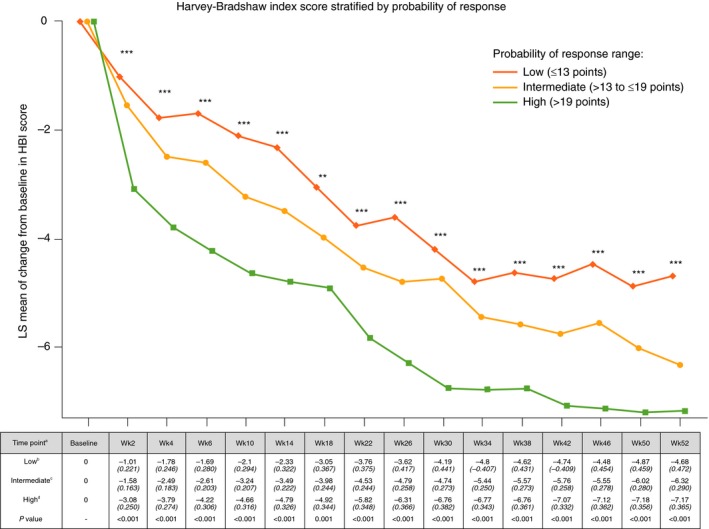
Figure 2.

GEMINI 2 clinical trial 52‐week reduction in Harvey‐Bradshaw Index stratified by CDST aAll values in table are mean HBI (SE). bLow probability; ≤13 points in CDST model at baseline. cIntermediate probability; >13 to ≤19 points in CDST model at baseline. dHigh probability; >19 points in CDST model at baseline. ****P < 0.0001, ***P < 0.001, and **P < 0.01. Bolded P values are statistically significant. CDST, clinical decision support tool; HBI, Harvey‐Bradshaw Index; LS, least‐squares; SE, standard error; Wk, week
