
Figure 7.
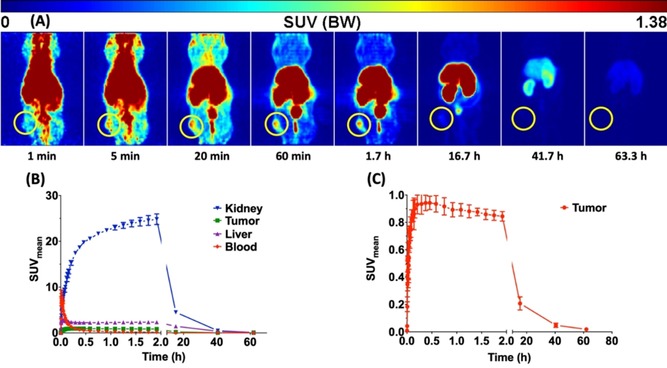
PET dynamic imaging. Maximum Intensity Projections (MIP) of a PET study with 64CuII‐labelled 6′ in an A431 tumour mouse after single intravenous injection into the tail vein. The tumour is localised inside the yellow circle (A). Representative time‐activity curves of kidney, tumour, liver and blood (B). Time‐activity curve of the tumour (C). Data are shown as mean ± SEM of two animals.