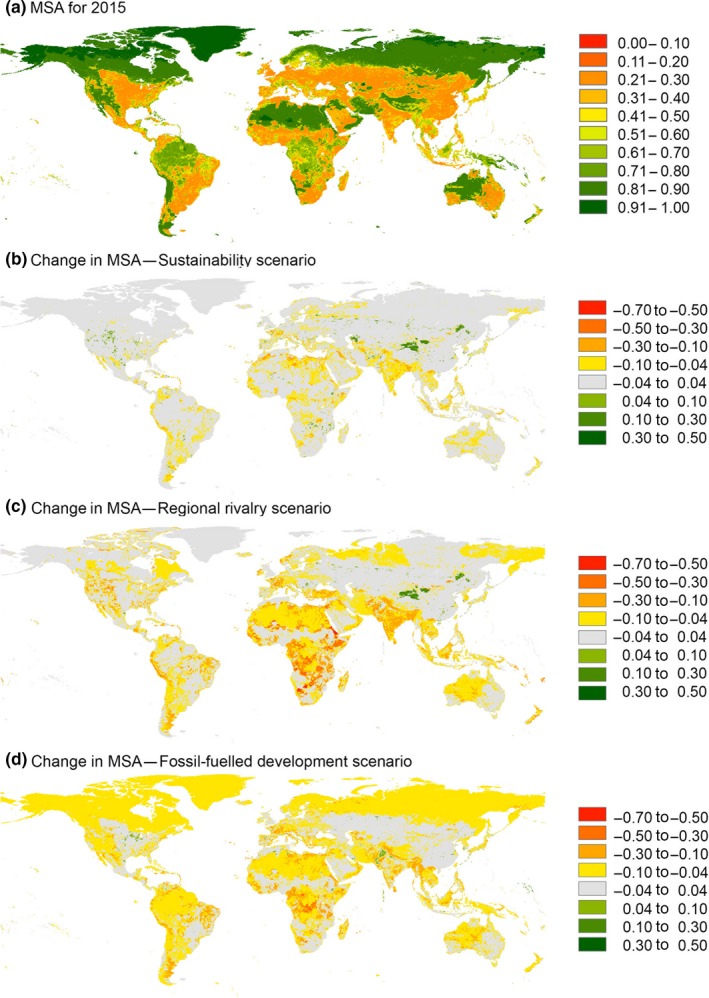
Figure 4.

Global patterns in (a) mean species abundance (MSA) values for 2015 and changes in MSA values from 2015 to 2050 for (b) SSP1xRCP2.6, (c) SSP3xRCP6.0 and (d) SSP5xRCP8.5. Values represent the mean across plants (Figure S3) and warm‐blooded vertebrates (Figure S4). For visualization purposes, the maps were resampled to a resolution of 0.25 degree based on the mean across the underlying values
