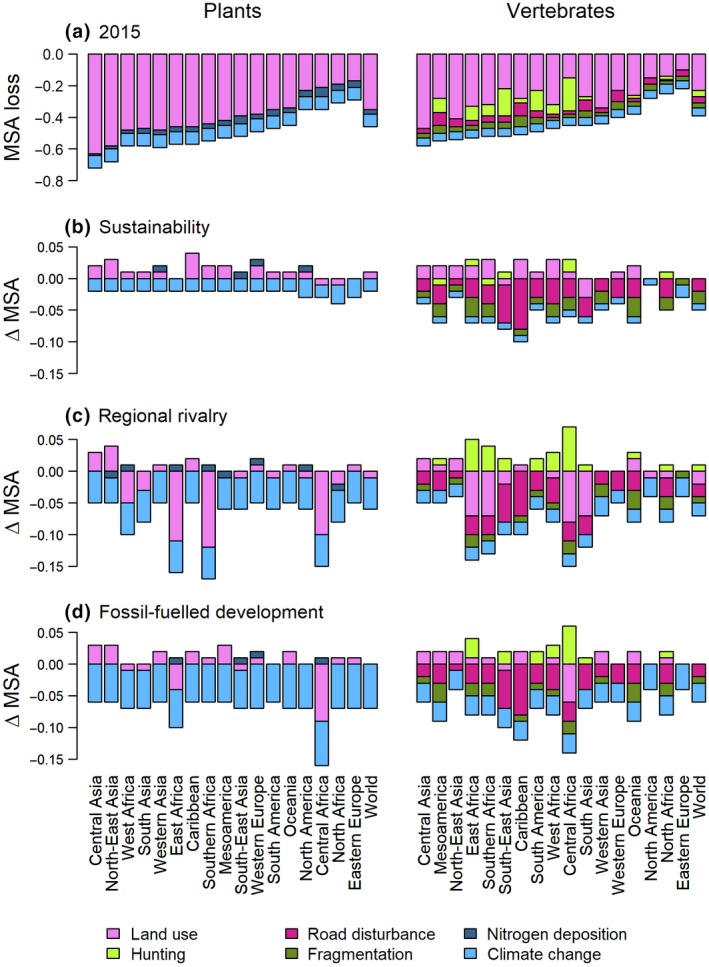
Figure 5.

Losses in mean species abundance (MSA) per pressure and per IPBES subregion and globally for plants (left) and warm‐blooded vertebrates (right) for 2015 (a) and changes in MSA resulting from changes in each pressure in each of the three future scenarios in 2050 (b–d). Underlying numbers are provided in Table S4
