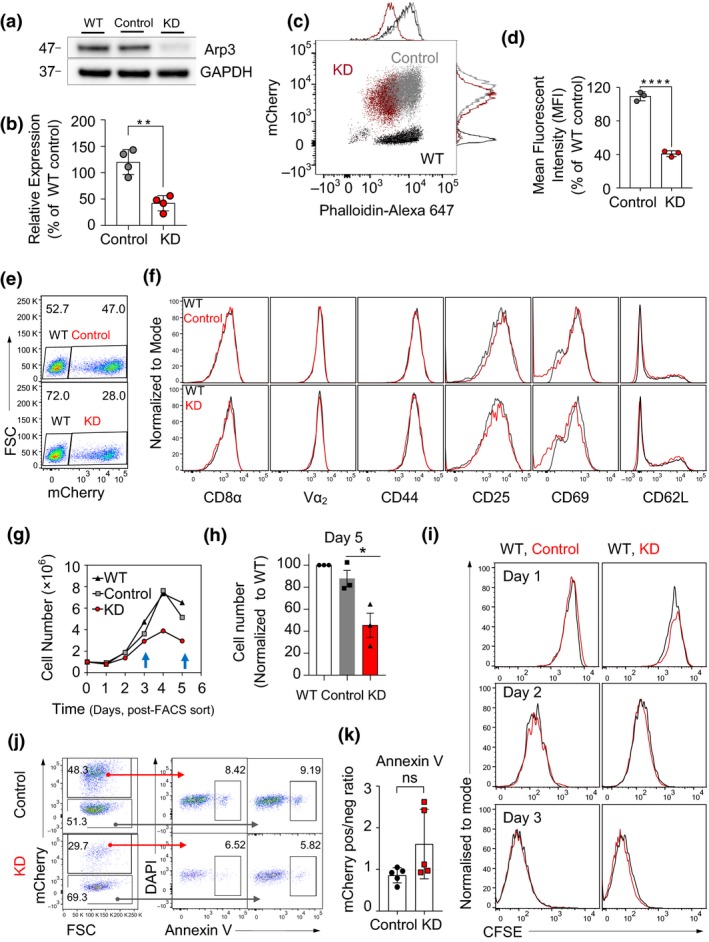
Figure 1.

Evaluation of the effects of Arp3‐knockdown (KD) on F‐actin, proliferation, cytotoxic phenotype and apoptotic status. (a) Representative immunoblot of Arp3 (ACTR3) expression levels in cells transduced with anti‐Actr3 short hairpin RNA (shRNA), control shRNA and non‐transduced wild‐type (WT) cytotoxic effector T lymphocytes (CTLs) lysed at day 5 post‐harvest. See also Supplementary figure 1a. (b) The column graph shows the densitometry analysis of the Arp3 protein band. Arp3 expression signal was normalized against WT expression level and corrected against glyceraldehyde 3‐phosphate dehydrogenase (GAPDH) signal (n = 4 independent experiments, **P = 0.0014, also see Figure 1a, b). (c, d) Total F‐actin content in the Arp3‐KD. (c) Flow cytometry plot demonstrating phalloidin staining of F‐actin; KD in red, WT in black, control in gray. (d) Quantification of total F‐actin in Arp3‐KD CTLs on day 7 post‐isolation, 48 h post‐fluorescence activated cell sorting (n = 3 independent experiments, ****P < 0.0001). The relative fluorescence expressions were normalized to WT control. (e) A representative FACS plot shows transduction efficiency of splenocytes harvested from Lifeact‐GFP×OT‐I mice on day 5 post‐transduction (n = 4 independent experiments). (f) FACS histograms of transduced T cells (red) and WT [non‐transduced cells (gray) acting as an internal control] stained with anti‐CD8α, anti‐Vα2, anti‐CD44, anti‐CD25, anti‐CD69 and anti‐CD62L antibodies as indicated (data from day 6 following T cell isolation; representative results of three independent experiments). (g) Growth curve of FACS‐sorted transduced CTLs and WT control over 5 days (counting commenced 48 h post‐thawing, day 6 post‐harvest). See also Supplementary figure 1c, d. (h) Quantification of cell numbers compared with WT cells on day 5 post‐FACS sort (n = 3 independent experiments, *P = 0.03). (i) Carboxyfluorescein diacetate succinimidyl ester (CFSE) profiles of control transduced and Arp3‐KD CTLs for 3 days post‐staining on days 6–9 post‐harvest (representative of three independent experiments between days 6 and 11 post‐harvest, see also Supplementary figure 1b for CFSE labeled prior to cytokine stimulation of splenocytes). (j) Representative flow cytometry plots illustrating Annexin V staining in vector control, Arp3‐KD and non‐transduced internal control. (k) The mCherry expression ratio between transduced and control (non‐transduced) Annexin V+ cells (data pooled from two independent experiments; days 6–8 post‐harvest). ns denotes not significant. Data are represented as mean ± s.d.; statistical significance was calculated between control and KD cells using the unpaired Student's t‐test. DAPI, 4,6‐diamidino‐2‐phenylindole; FSC, forward scatter; GFP, green fluorescent protein.
