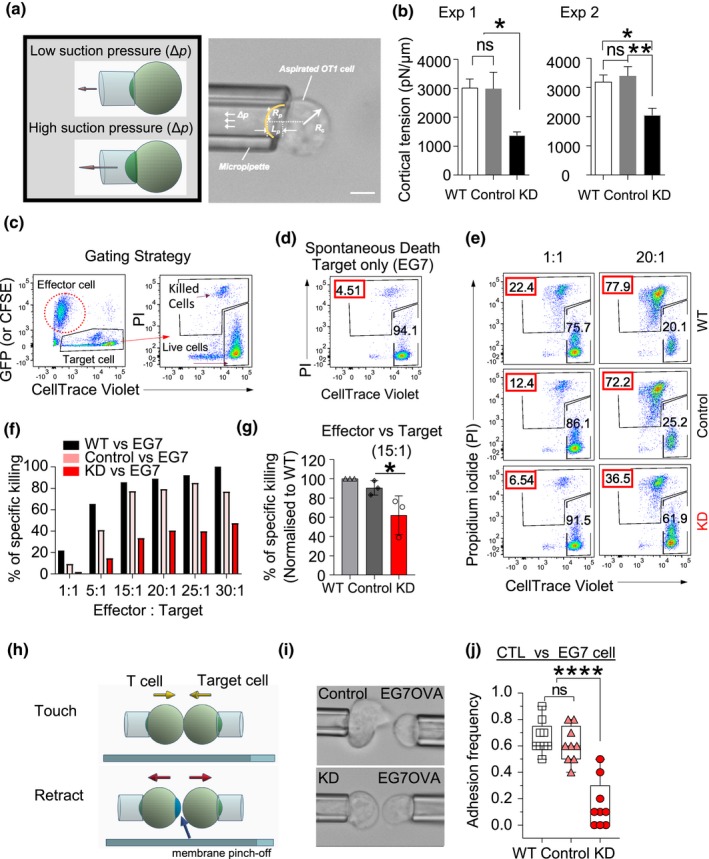
Figure 6.

The influence of Arp3 reduction on cytotoxic effector T lymphocyte (CTL) cortical tension, cytotoxic function and interactions with the target cell. (a) Schematic diagrams and photomicrographs of micropipette aspiration of a CTL. The aspiration pressure inside the pipette (Δp, low for holding cells, high for cortical tension measurement), the inner radius of the pipette (R p), the radius of the spherical portion of the cell outside the pipette (R c) and the length of the cell tongue aspirated inside the pipette (Lp) are indicated. (b) The graph shows cortical tensions in OT‐I cells on days 5–6 post‐harvest. Data represent mean ± s.e.m. of two pooled independent experiments [wild type (WT) and vector n = 10 and KD n = 11 cells/experiment, one‐way ANOVA, followed by Tukey's multiple comparisons test was performed, *P = 0.0148 (exp1), *P = 0.0144 (exp2) and **P = 0.0049] scale bar, 5 μm. (c) FACS plot shows the gating strategy for sorted CTLs co‐incubated with the specific (EG7‐OVA) target cells over 3 h measuring the experimental death (killed cells gate). (d) The “spontaneous death” of EG7 propidium iodide (PI)+ (4.51%) cells, when target cells were incubated alone. (e) A representative example of the Arp3‐KD cells co‐incubated with target cells (EG7‐OVA) at 1:1 and 20:1 E/T ratios (WT:target cells, top panel; control:target cells, middle panel, KD:target cells, bottom panel). Red box, the percentage of experimental death. (f) Bar graph of a representative cytotoxicity experiment (n = 3). See also Supplementary figure 1. (g) The column graph shows the percentage of killing normalized to WT for 15:1 E/T ratios of n = 3 independent experiments; mean ± s.d., an unpaired Student's t‐test was used, *P = 0.03. Cells were FACS sorted on days 6–7 and used in assay on days 9–11 post‐harvest. (h) Schematic of single‐cell micropipette adhesion frequency assay. OT‐I T and EG7‐OVA cells were aspirated by two opposing micropipettes, where the target EG7 cell was driven by a piezoelectric translator to touch the T cell for 20 s and then retracted. (i, top panel) Photomicrograph of a control cell reaching out to a target cell even before the touching step. (i, bottom panel) A KD cell fails to make any visible interaction, no interaction, and well‐defined shape even during the “touch” step. (j) Adhesion frequency measurements for individual T cell–EG7 pairs with 20 s contact durations. Data were pooled from two independent experiments (n = 9, four or five cells/experiment average of ten touches/cell). The results are represented in box and Whisker plots, with a median, first and third quartiles outlined by the box, and minimum and maximum values of the data set denoted by Whiskers measurements, ****P < 0.0001 using one‐way ANOVA, followed by Tukey's multiple comparisons test. ns denotes not significant. FACS, fluorescence‐activated cell sorting.
