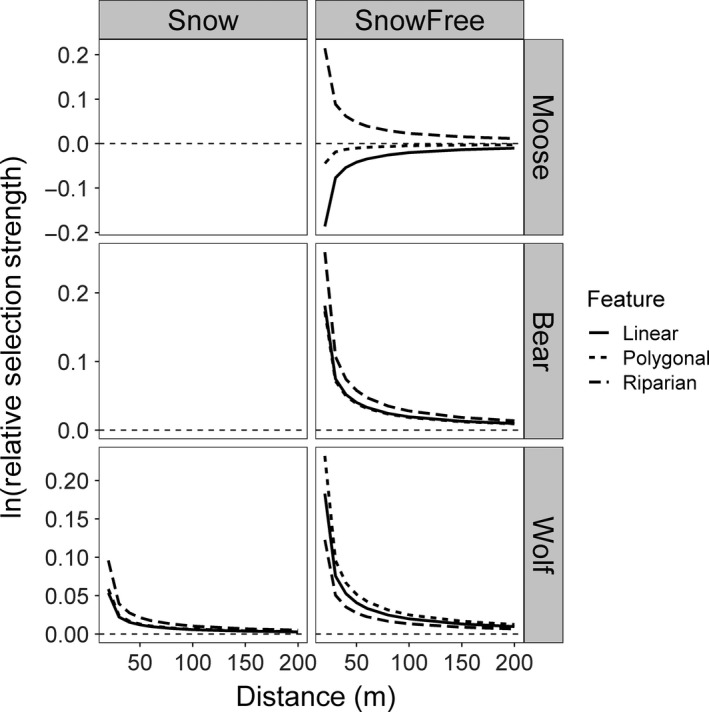
Figure 3.

Relative selection strength of anthropogenic linear features (solid line), polygonal disturbances (dotted line) and riparian features (dashed line) by moose, bears and wolves. Dotted horizontal line represents no response, whereas above that line the population is selecting to be closer to that feature than expected, and below the dotted line the population is selecting to be farther from that feature than expected. Caribou are not shown due to insufficient individuals to obtain population‐level averages. The relative selection strength for anthropogenic disturbances and riparian areas was calculated as the expected tendency of moving towards a given feature type compared to away from it (Appendix S3; Avgar et al., 2017)
