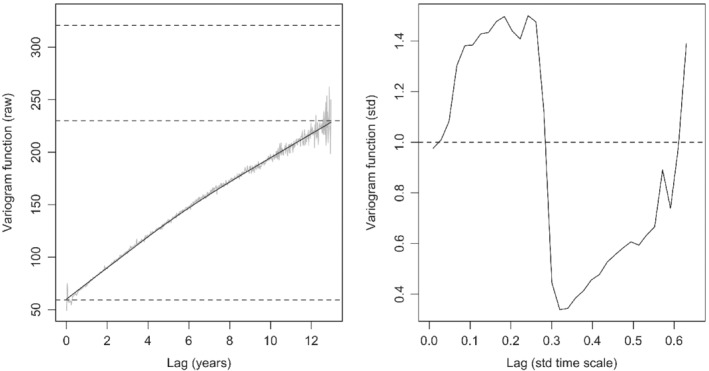
Figure 3.

Variogram based on the raw residuals against separation in time, as years (left panel) with the dashed lines representing total process variance (320.61); the smooth black line is the empirical variogram function with upper and lower dashed lines (229.92 and 59.07, respectively) marking partitions for between‐patient variance, within‐patient variance, and residual error. Variogram for transformed residuals against the lag based on the transformed time scale (right panel). Each plot was averaged over bin sizes of 0.017 (corresponding to weekly intervals); bins with fewer than 20 residuals were excluded
