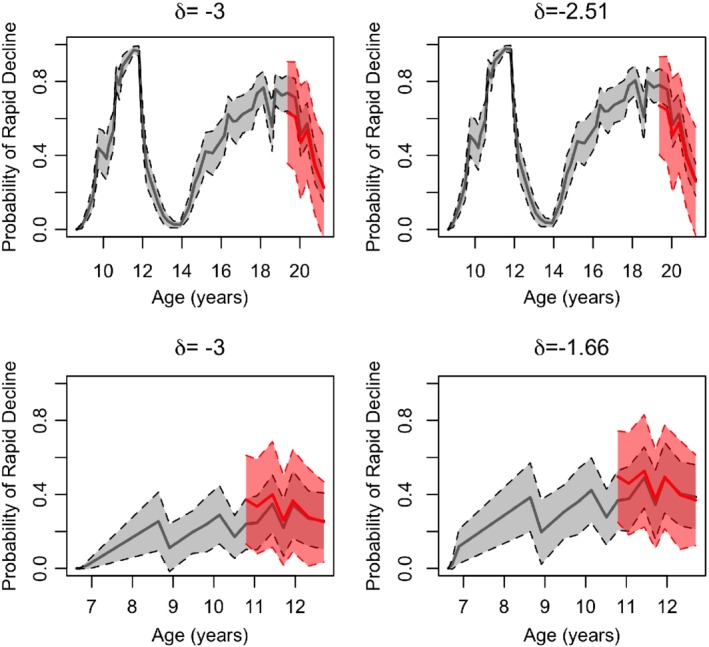
Figure 6.

Predictive probabilities of rapid decline (defined as δ c < −3% predicted/year) (first column) corresponding to patients in Figure 5 (first row is the female F508del heterozygote; second row is the male F508del homozygote); personalized threshold δi (ti*) is shown for each patient (second column), including bootstrapped 95% CI and forecasts. CI, confidence interval [Color figure can be viewed at http://wileyonlinelibrary.com]
