Figure 5.

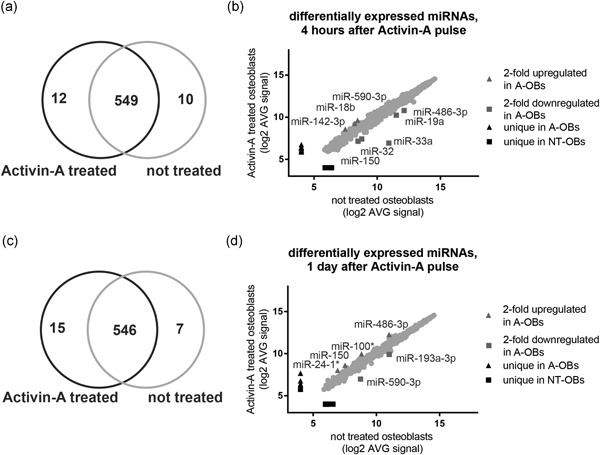
Osteoblast miRNA expression profiles were modulated by Activin‐A treatment. (a) 12 miRNAs were uniquely detected in Activin A‐treated osteoblasts, 10 miRNAs uniquely in the untreated cells, and 549 were detected in both conditions, 4 hr after the start of Activin‐A treatment. (b) miRNAs uniquely detected in Activin A‐treated osteoblasts, untreated osteoblasts, and with more than 2‐fold difference in detection, 4 hr after the start of Activin‐A treatment. (c) One day after the start of Activin‐A treatment, 15 miRNAs were uniquely detected in Activin A‐treated osteoblasts, 7 miRNAs uniquely in the untreated ones, and 546 in both conditions. (d) Number of miRNAs uniquely detected in Activin A‐treated osteoblasts, untreated, and with more than 2‐fold difference in detection, 1 day after the start of Activin‐A. Only probes detected above background and annotated to known miRNAs are shown (p < .01). A‐OBs, Activin A‐treated osteoblasts; miRNAs, microRNAs; NT‐OBs, not treated osteoblasts
