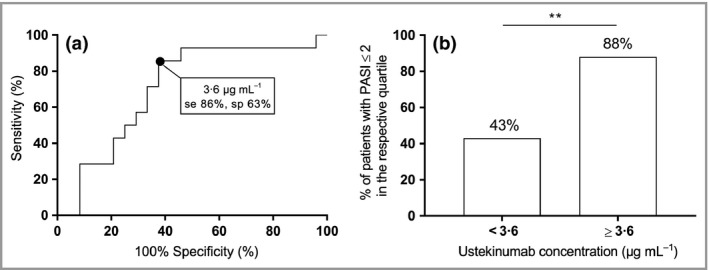
Figure 3.

Defining an ustekinumab cut‐off for optimal clinical response. (a) The best receiver–operating characteristic curve [area under the curve 0·71, sensitivity (se) 86%, specificity (sp) 63%; P = 0·036] for optimal clinical response [Psoriasis Area and Severity Index (PASI) ≤ 2] indicated an optimal ustekinumab concentration cut‐off at week 4 after injection of 3·6 μg mL −1. Positive predictive value 88% [95% confidence interval (CI) 67–97], negative predictive value 57% (95% CI 43–70%). (b) Percentage of patients with an optimal response based on the ustekinumab concentration threshold of 3·6 μg mL −1 (P = 0·004). Only patients treated with ustekinumab for ≥ 28 weeks (steady state) and samples collected at week 4 ± 5 days after injection were included (n = 38). **P < 0·01.
