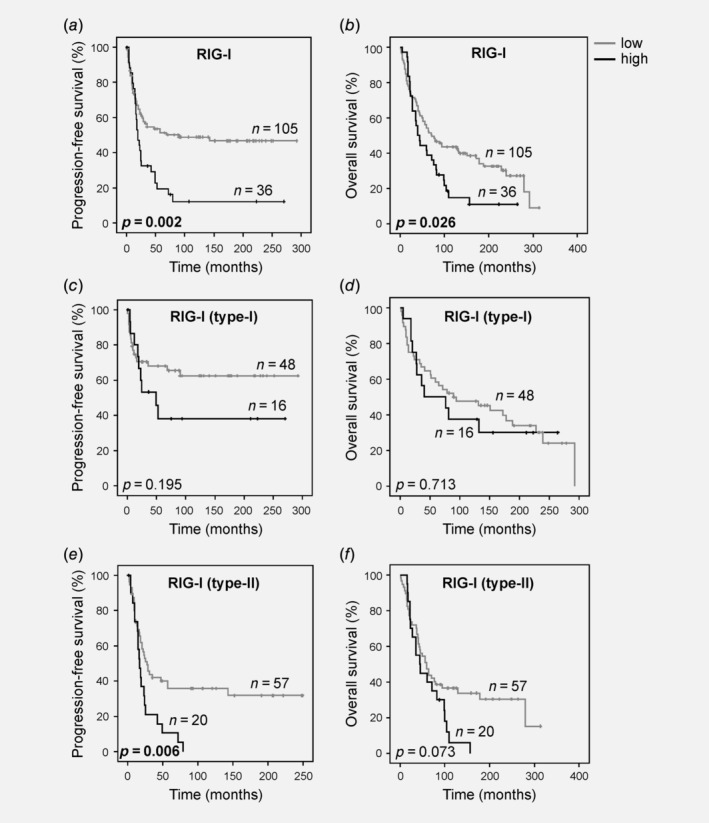
Figure 3.

RIG‐I levels predict ovarian cancer outcome. (a, b) RIG‐I expression was dichotomized according to 75th percentile statistics and PFS and OS were analyzed for the whole cohort using the Kaplan–Meier methodology (n = 141). (c, d) RIG‐I expression was dichotomized according to 75th percentile statistics and PFS and OS were analyzed specifically for Type‐I cancers (low‐grade serous, mucinous, endometrioid and clear cell; n = 64). (e, f) RIG‐I expression was dichotomized according to 75th percentile statistics and PFS and OS were analyzed specifically for Type‐II cancers (high‐grade serous; n = 77). Abbreviations: PFS, progression‐free survival; OS, overall survival; RIG‐I, retinoic acid‐inducible gene‐I.
