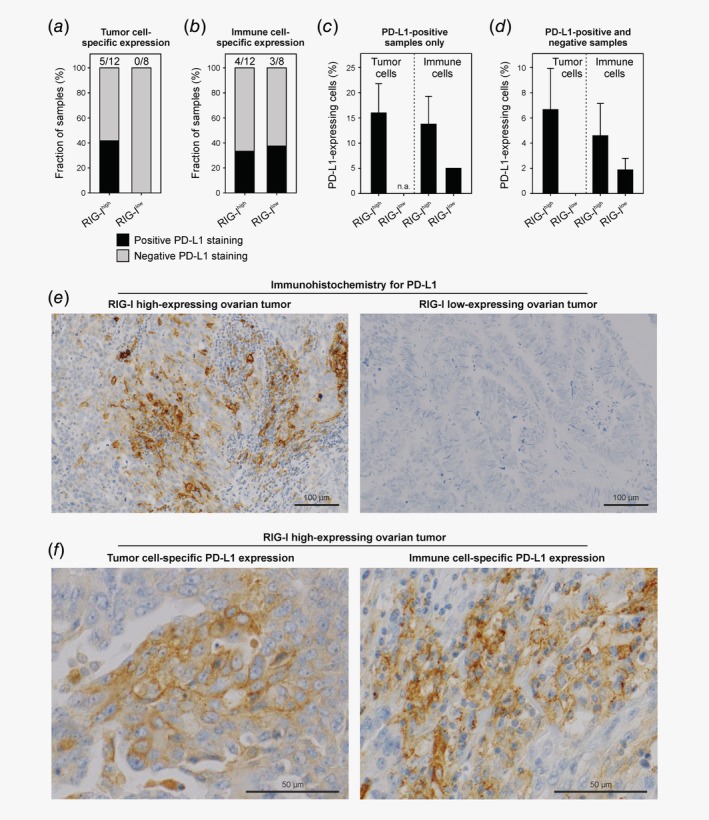
Figure 5.

PD‐L1 protein expression in RIG‐Ihigh versus RIG‐Ilow ovarian tumors. (a,b) Fraction of RIG‐I high‐expressing (n = 12) and low‐expressing samples (n = 8) staining positive or negative for PD‐L1 in tumor and immune cells, respectively. (c) Semi‐quantitative analysis of PD‐L1‐expressing tumor and immune cells in PD‐L1‐positive samples. (d) Semi‐quantitative analysis of PD‐L1‐expressing tumor and immune cells in PD‐L1‐positive and PD‐L1‐negative samples (all samples). (e) Representative microscopic images of PD‐L1 expression in RIG‐Ihigh versus RIG‐Ilow ovarian tumors. (f) Representative microscopic images of PD‐L1 expression in tumor and immune cells. No statistical analysis was performed for this descriptive, corroborative dataset and error bars in (c) and (d) represent the SEM. Abbreviations: n.a., not applicable; RIG‐I, retinoic acid‐inducible gene‐I; SEM, standard error of the mean.
